On Tap for This Week

This week is a lighter week.

  • Monday – Markets are closed
  • Wednesday – Housing starts and FOMC minutes
  • Friday – GDP

Housing starts I don’t think are as critical as they once were. It used to be that sales of houses were tied to a lot of other economic activity from buying new furniture to updates to existing homes. It used to be more a headline number and market mover.

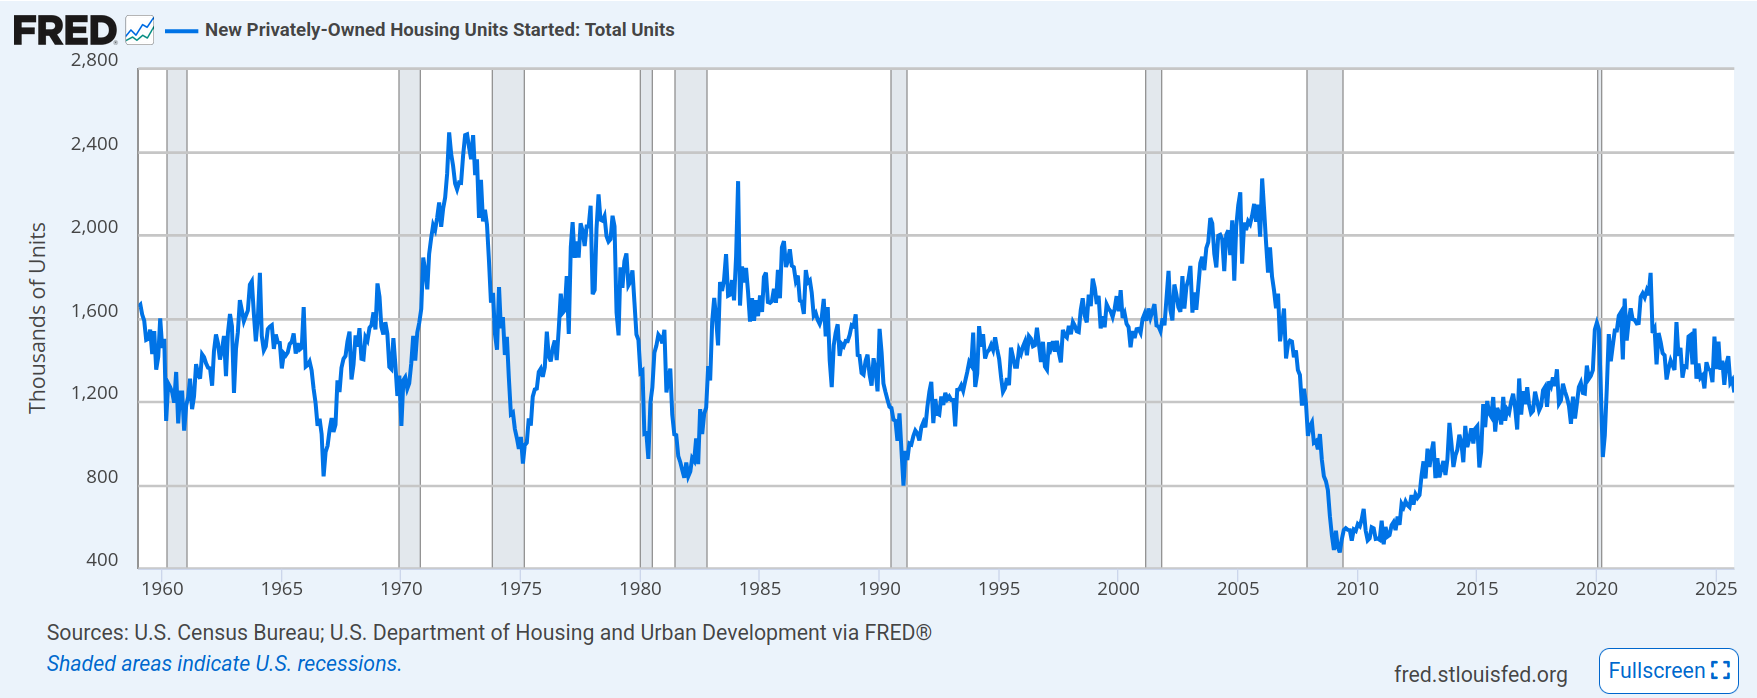
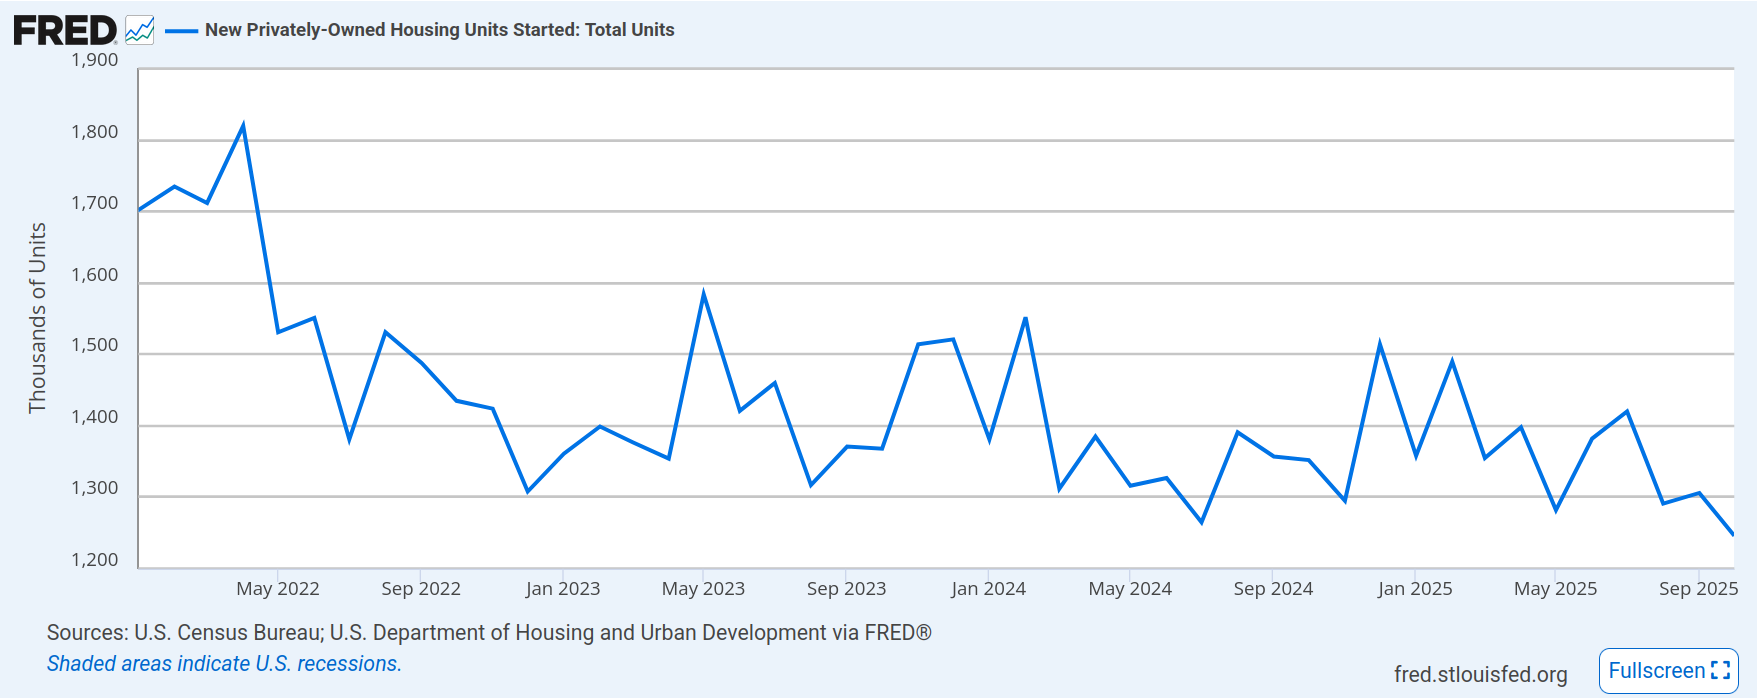
Here we see the last couple years of starts, compared to the historical numbers for housing starts. Although housing remains unaffordable for many, we don’t see a huge increase in starts over the last three years. From the chart above, we can see a jump shortly after the COVID lockdowns, but nowhere near enough of a bump to deal with the lack of housing created after 2008. And if you have to ultra-stretch your budget for a house, that doesn’t leave a lot for new furniture or trips to Home Depot.

The FOMC minutes, however, will be interesting to see. We’ll get a view of how hawkish or dovish the over-all committee is. And remember, even if Trump installs a rate-cut happy lunatic as Fed chair, that lunatic doesn’t set policy. It’s voted on by the full committee. Which is why Trump is testing his ability to fire other Fed members. In the presence of tax cuts and proposed spending increases, a Fed that cuts rates will be adding stimulus on top of stimulus when the employment rate is in the range of full employment. Which would attack the debt level by devaluing the dollars in which the debt had been issued. But then interest rates (should) climb, or the dollar (should) fall to offset the devaluation of the dollar. When the dollar falls, oil and other commodities climb in price, pushing more inflation. And there is no guarantee that the increase in wages would outpace inflation. We would almost certainly all be worse off.


A quick note for folks that think 0% unemployment is full employment, that’s not how it works. Inflation has a statistical relationship with unemployment known as the Philips curve. Below a certain level, like 7% unemployment, a decrease of 1 percentage point of employment has no impact on inflation. At lower levels of unemployment, a 1 percentage point decrease in unemployment drives higher inflation. Why? Because when the labor market gets tighter (and everyone is immediately swept up into a new job), companies wind up bidding up wages to attract workers.

Those workers have more money for cars, food, vacations, and so on, and that drives inflation from the demand side. Also, as wages get bid up, more workers come off the sidelines into the workforce. These range from moms who no longer see it economical to stay at home, or retired people seeing opportunities, or people who left the job market to write a cook-book, etc. You can get a month to month increase in unemployment as these people come back into the workforce, while having a very tight labor market. As we pushed down toward 3% unemployment post-COVID, that contributed to an increase in inflation. It was great because everyone’s salary was jumping, but few people feel it outpaced the impact from inflation.

The Weirdness in Unemployment Claims

Here are the first time unemployment claims from 2000 to 2008. Although the first time claims rate accelerates before the 2001 recession, that doesn’t happen in every recession, with the first time claims generally being a trailing indicator. The lowest point on the chart, touched briefly at the peak of dotcom boomery, is about 260k.

Here is the last couple of years of first time claims. Its highest point is about 260, which it touches during spikes. Although it looks more variable than the chart above, it’s not. It might be even slightly less variable. It’s low points are at 190,000. If I were to look at this, I would assume the jobs number would be substantially higher. We’ve created about 150,000 jobs over the last six months. To absorb new entrants into the labor market, that should have been 600,000. To grow, that should have been closer to 800,000.

There is a degree to which we could be job hugging. No one is convinced they can hire a decent replacement. No one is convinced they can find a better job. People aren’t getting fired and they aren’t quitting. And there aren’t enough new jobs to absorb new entrants. What we should see in the JOLTS data are low separations, low hires, and low openings. But that’s not what we’re seeing. Which actually further confuses the situation.

Separations and hires are still historical norms. Openings are still high. This leads me to be even more convinced, every passing week, that we’re measuring the wrong thing. That’s dangerous because we can be optimizing the wrong numbers. Maybe the Fed is too worried about the job market. Maybe it’s doing better than anticipated. I’m more convinced the job market is structurally different than it was even 10 years ago. That means comparing even 2006 numbers with 2026 numbers could be misleading. Is the gig economy, ranging from Uber to Only Fans the new “go to” when you get fired? Should we be measuring the number of gig workers? The BLS understands the need. But the current statistics are too spotty and hard to compare (also because of the lack of history).

If this seems like splitting a hair, let’s take a look at some policy choices. The first is to leave short term rates where they are. This is likely having a depressing impact on the labor market. If we depress the labor market too much, we go into recession. (Although our latest Keynesian experiment may offset that). If we cut rates slowly, we relieve pressure on the labor market, but does that cause more competition for labor to the point where we get inflation? Or does it ease the pressure to relieve the risk of recession? Finally, there is aggressively cutting rates, which what the economics illiterate Cheeto wants. That could drive a freight train of inflation through the economy and tank the dollar. But from the labor market data, it’s hard to say which is right.

All the options seem logical. If you look at the monthly jobs number, it looks like recession is right around the corner. If you look at people losing their jobs and filing unemployment, we have a perfectly fine labor market. If you look at the JOLTS data, the labor market is dangerously tight, with many more openings than workers. Or is the JOLTS data signalling weakness as we drop below the 5,000 level? I’m more partial to the jobs number and its erratic cousin, the ADP report.