What’s Happening Today?

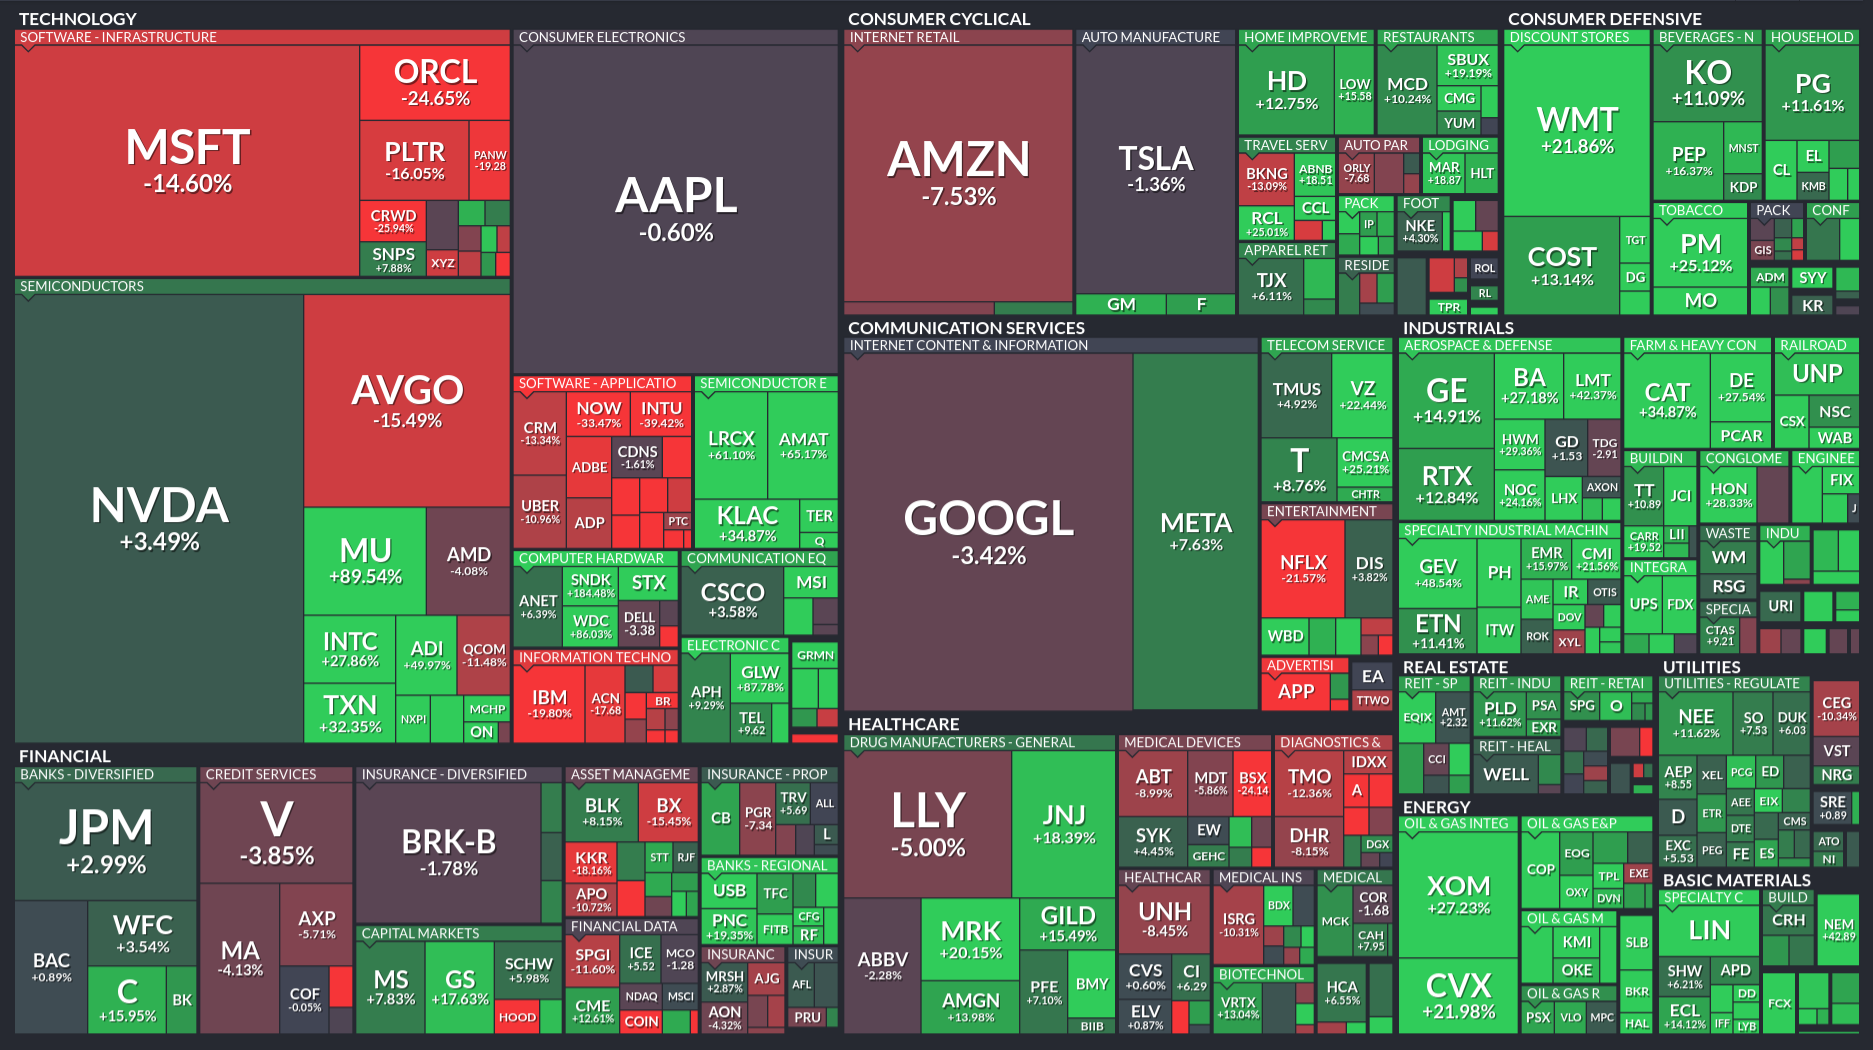
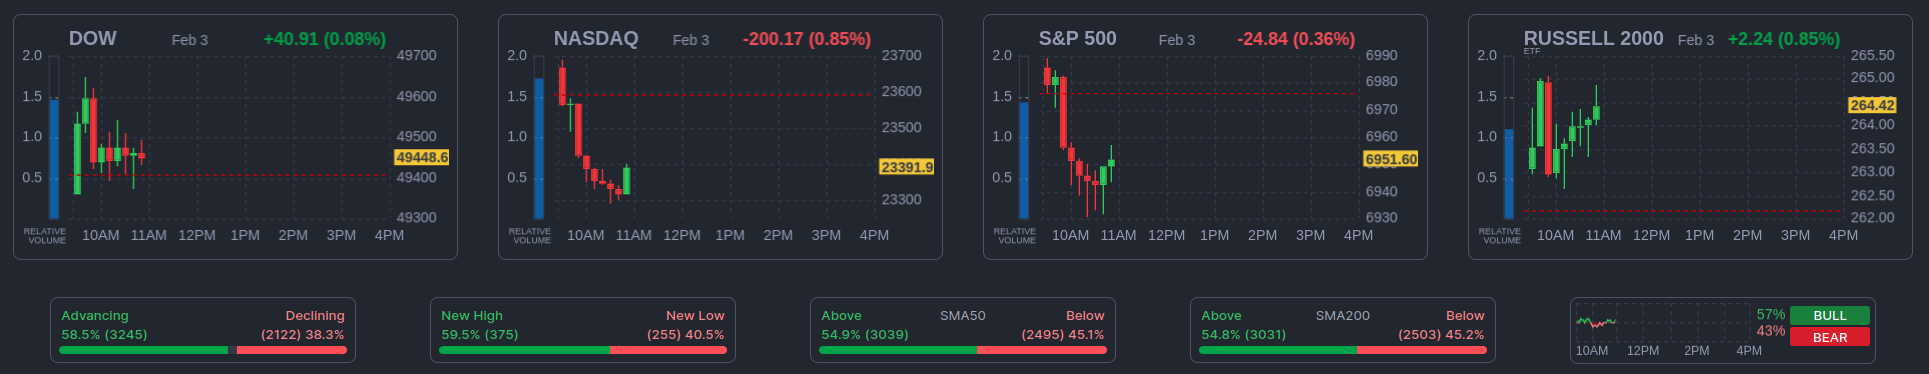
Taken about 8:45 AM EST in the pre-market. In short, this is the PPI coming out hot. 2.9% annual inflation versus and expected 2.6%. For the market this is as bad as, if not worse than, the CPI coming in hot. If the CPI comes in above estimates, that just means rates might rise. But if the PPI comes in hot, and the CPI doesn’t, it means margins get squeezed. It means that for a $100 of revenue, it means less profit. If both CPI and PPI were going up, that’s not good, but businesses are able to hold their margins. As happened earlier in the inflation burst, CPI went up faster than PPI in some cases, and margins expanded.

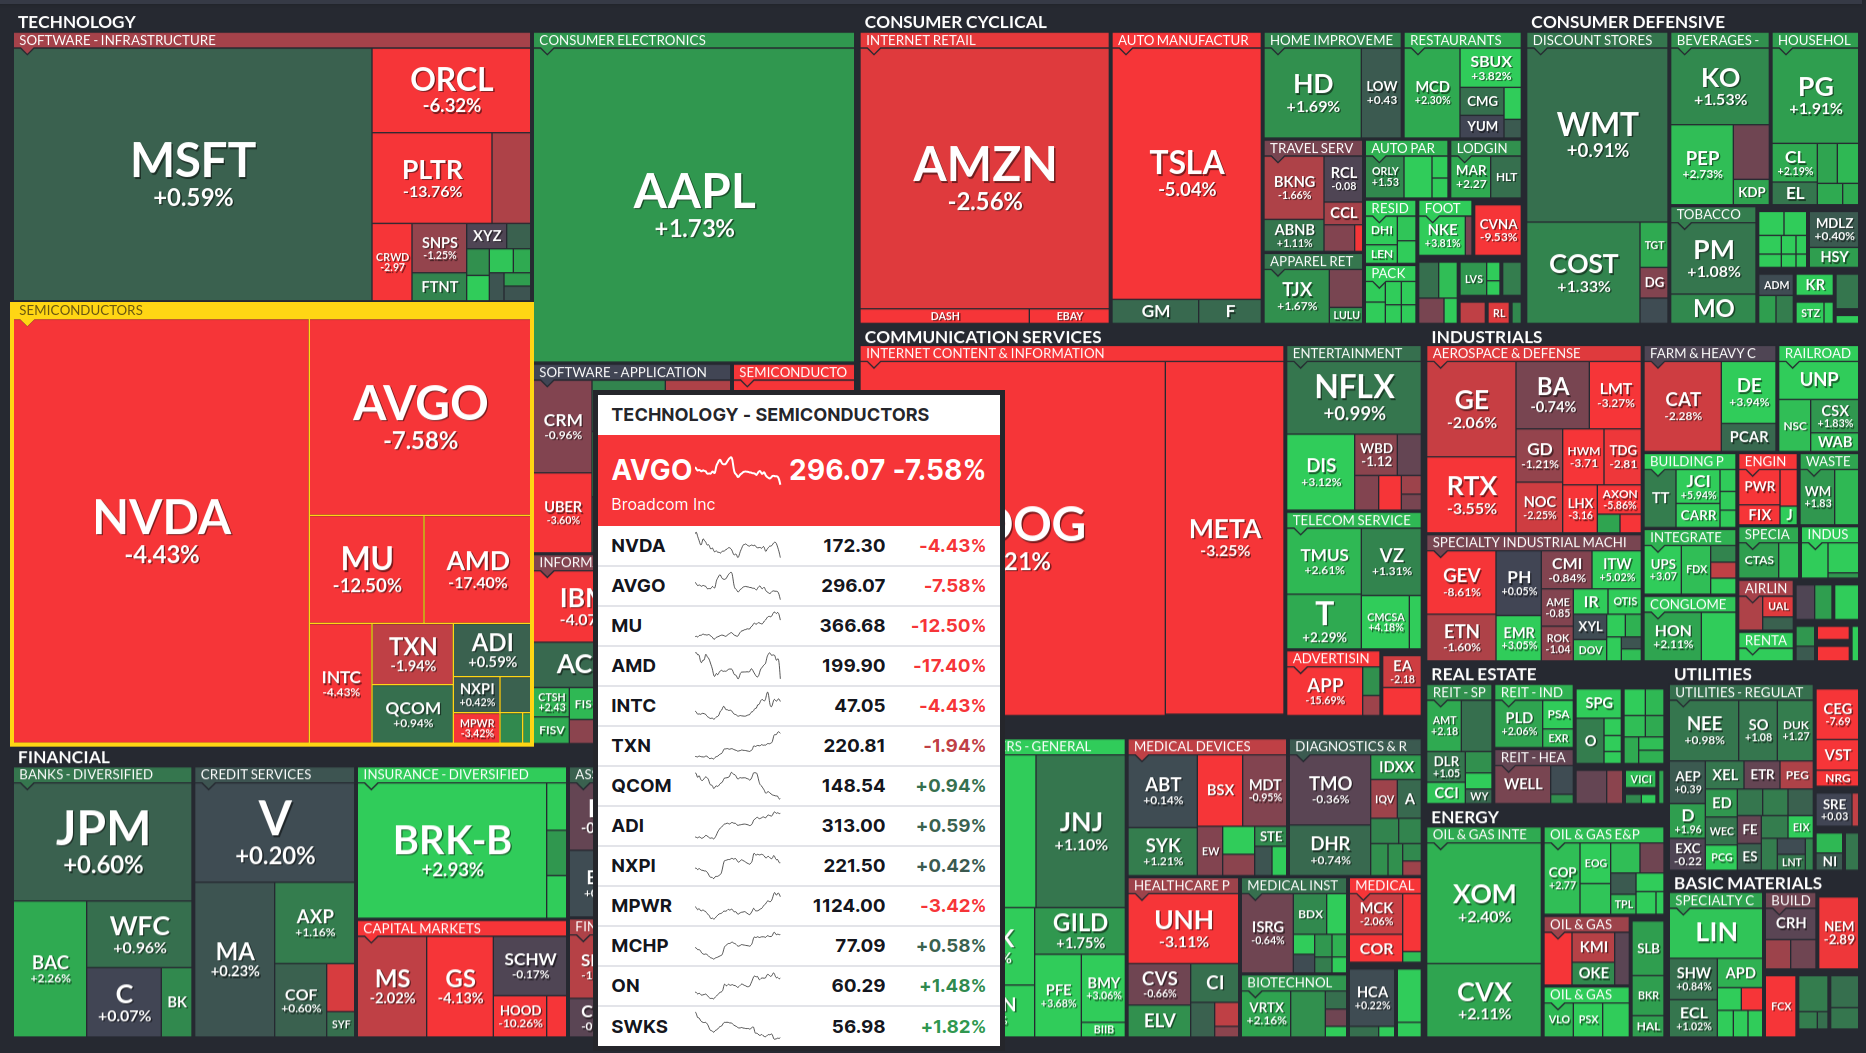
That explains some of the impact. The other part of it is the idea that AI isn’t playing out the way people hoped it would. We are seeing a concerted push by companies to adopt AI and (despite the protestations of $XYZ – Block), we have yet to see significant changes in productivity. There may be reasons for this that have nothing to do with AI. First and foremost, it’s a new technology. The “recipe” for mixing it into an organization to boost productivity and reduce costs may need to evolve. With a lot of churn, it’s hard to know if chat bots, RAG (retrieval assisted generation), or some yet undiscovered pattern will produce the best outcome. One that doesn’t give away free stuff from vending machines or cite non-existent cases in court filings. (So, how much do you want to trust an LLM to correctly categorize a major business expense that could cost you in interest an penalties?) But until we do it looks like NVidia may be the only winner as they sell more GPUs to companies that may not have the electrical grid power to turn them on?

But let’s get back to macro. Long rates are dropping, but the 2-year is kind of holding in a range. These are bond price futures, meaning when they go down, interest rates go up. (The price of a bond is the inverse of the rate). The bottom two are 10 and 30 year bonds, respectively. Businesses are generally sensitive to the 10 year rate. Prices were falling on the 10 and 30 up to February, ,while the 2 year stayed in its trading range. (I kind of compressed the 2 year graph to give a better sense of how little movement there was in the 2-year, given a similar $3 range in the 10 year). The fact that long bond prices were going down, while shorter term maturities were stuck, meant that long rates were coming down while short rates were holding. (The shorter you go the closer you track the Fed Funds rate).

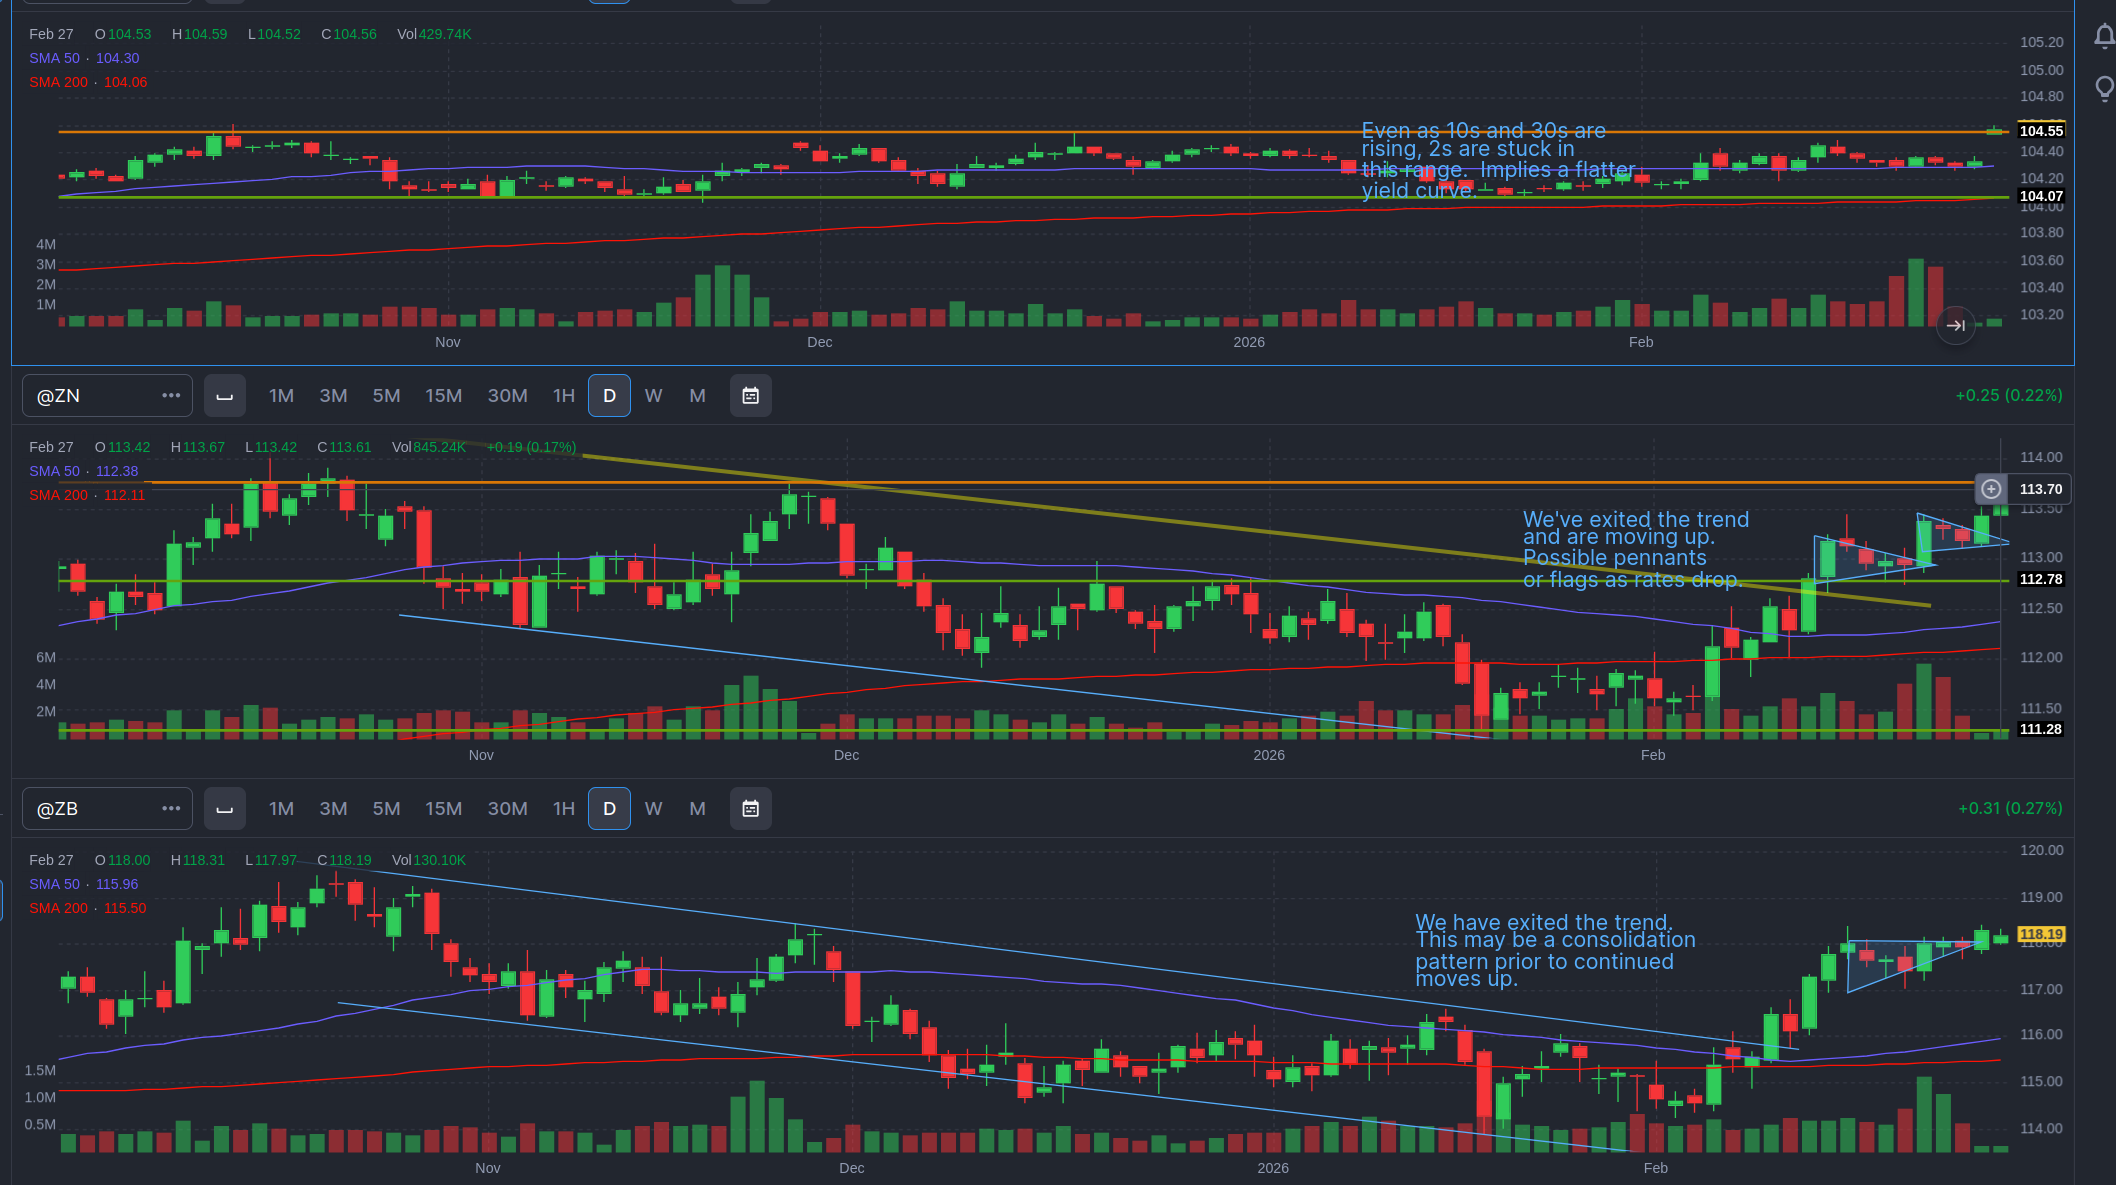
A normal yield curve has the lowest rates for the shortest maturity debt. Everything beyond that carries more risk. These risks may be interest rate risks (the interest rate falls and so the price of your bond falls), or re-investment risk (the rates go down and you can’t re-invest at the same rate). There’s almost no risk at 30 days to 90 days. At thirty years, there’s almost a certainty things will be different and you might be underwater in your bonds or unable to secure a similar rate when the principal redeemed. The price of the bond is a negotiation between buyers and sellers about future interest rate risks.

When the price of long bonds start going up, it means that people are betting future rates are going to be lower. This is because they expect lower demand for capital in the future – likely because the economy is slowing. A rate inversion, when the rate on the long bond falls below the short rates, is a sign investors expect the economy to be in recession so rates will be reduced to stimulate the economy. That’s why we get yield inversions, and why they tend to be at the start of, or just in front of a recession. Also, in most cases, the short term rates go up because the Fed has been slowing the economy. This last inversion period was both large in scope and did not result in a recession, so far1. (And there won’t be as much borrowing to invest in new businesses). What you want to see is the entire yield curve (the interest rates at various maturities) move down together. Lower rates plus strong future expectations.

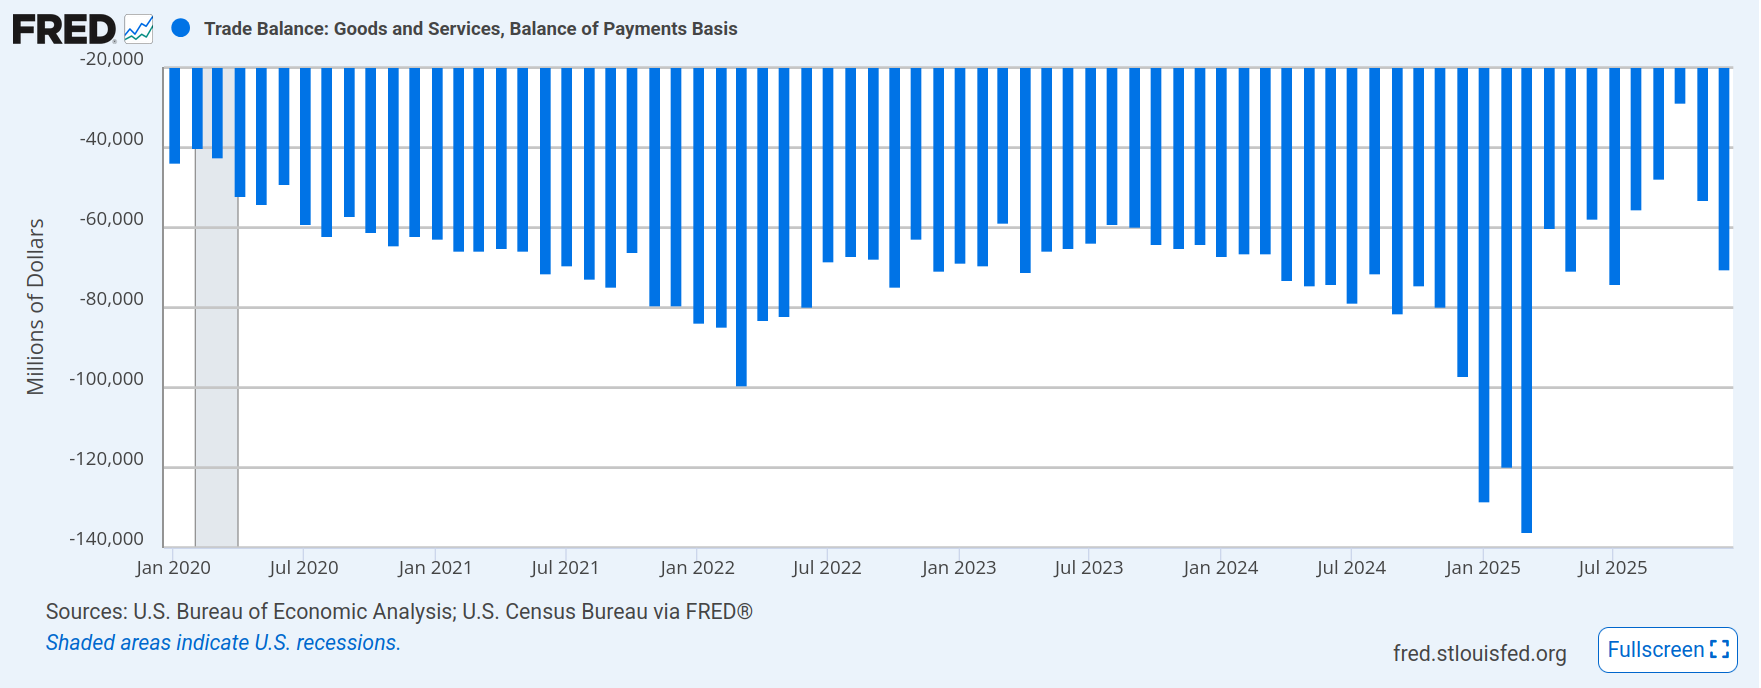
Which brings me to this graph, the balance of payments (trade deficit). If you eye-ball a line across the graph, between -60,000 and -80,000, you probably have close to the average trade deficit. Then you have “Liberation Day” in April and a huge spike. What’s that about? Those are businesses bringing in inventory prior to the tariffs taking effect. That inventory was spent down in the next few months, as businesses imported less because their inputs were sitting in warehouses. At some point they are going to have to bring in more product, and that’s why I think we’ll be back to roughly the same (maybe a hair smaller) trade deficit. We’ll have to see how it plays out, but the last reading was in line with the historical average.

That suggests that businesses are continuing to import final goods and inputs for their manufacturing at nearly the same rate as before the tariffs. Some businesses elected to eat the tariffs (note it is businesses that pay tariffs, not governments) rather than pass those costs onto consumers. They were assuming the tariffs would get rolled back and it’s better not to piss off your customers. They might even get refunds. But given the number of businesses that sold the refund rights to Lutnick’s kids at 20 cents on the dollar (yes the same one working for the president as the secretary of commerce), I don’t think they held out high hopes. We’ll have the lovely spectacle of the commerce secretary’s kids suing the federal government for refunds of illegal tariffs imposed by the administration, which they scooped up at bargain basement prices. Ain’t corruption grand?

If businesses are importing as much, and they are paying higher prices, and they have spent down their inventory, we might FINALLY start seeing the consumer level inflation impacts of tariffs. But we’ll first see it at the business level. Businesses have eaten the tariffs, for now, but will either suffer lower margin or start passing on those costs. That means businesses will start cutting costs to deal with tariffs and the easiest way to cut costs is to reduce head-count. When people no-work they no-spend. Block’s hope is the reduction in headcount (maybe over-hiring a few years ago), will result in better margins as costs fall, even if revenue falls. But, like I said earlier, there is no clear indication we’ve figured out how to incorporate AI into businesses or operate an AI provider profitably. It’s all subsidized by giant pools of investor money.

If you expect a softer economy (not radically expecting recession tomorrow), you want to hedge your risk (equity) exposure by buying bonds. Foreign companies have become a lot more wary of buying bonds, except there is no other currency with the depth of the dollar. And therefore US debt is still attractive. (TINA – there is no alternative right now). If short rates hold up because inflation actually starts making its way into the consumer market (not in one quick burst but trickling in as business after business has to raise prices), and the Federal Reserve can’t cut without resuming inflation, you should expect the economy to slow. By how much? I don’t know, but I would not expect long rates to stay where they are. I expect them to come down, or there is an increase that the Federal Reserve would need to step in by shoving liquidity into the system.

The two year has been betting the interest rates will stay about the same. Until February, the long rates were making similar bets (or maybe a little AI optimistic combined with nervousness about the Fed forced to cut rates combined with dollar de-risking). They were holding or going up slightly. Now they’re falling, compressing the yield curve. At the same time business costs may be going up. With a Fed that can’t immediately inject liquidity until the economy gets a lot worse. What a lovely little shit-show we’ve built.


This is not investing or investment advice to you, or anyone. It’s is provided for your entertainment purposes only. And if you are investing, contact a professional before making any decisions. Buying and selling stocks, futures, or any investment is a risky activity and can cause you to lose money, including the principal which you invest.

  1. It may be the ONE TIME that the Fed slowed the economy but didn’t throw it into recession. The so-called soft-landing. Something I did not think could be done and therefore missed out on some returns (albeit at a higher risk). ↩︎

What Are You Looking At?

This is the “cash” index ($SPY) for the S&P 500. That’s different from the index that most people look at, which is actually the price of a futures contract on the S&P 500. The price action is a little different, but not radically different. But the S&P 500 that everyone talks about in the news is actually an expectation of the S&P 500 price in the very near future, traded almost continuously. So there are fewer gaps in the price action. The cash index primarily trades during normal trading hours in the US. The chart below is the futures contract and is smoother, with fewer gaps, but it’s basically the same movement.

But what is it really? It’s the behavior of the 500 companies included in the index. The 500 best companies? The 500 most representative companies? The 500 largest companies? Yes and no to all of those questions. These companies fall into sectors: technology, consumer cyclical, consumer defensive, financial, communication services, healthcare, industrials, real estate, utilities, energy and basic materials. From the heat map below you can get a sense of their relative size and how they’ve performed over the last three months. Sorry, if you’re red-green color blind, but for squares that are large enough, you get the percentage change.

We have different stories about the expected behavior of the sectors under different economic conditions. For example, during a recession, when people are losing their jobs, we expect consumer defensive stocks to hold their value while consumer cyclical stocks to fall. And if we look at the 3 month performance, we can see that defensive stocks have out-performed the aggregate cyclical stocks. These stories aren’t perfect, like maybe TJ Max (TJX) is doing okay because people are bargain hunting more, and maybe McDonald’s (MCD) is doing better because people can’t afford nicer restaurants.

We’ve had a set of contradictory stories. Financials have hit hard, and consumer cyclical and communication services and technology have been meandering to falling. That suggests a slowdown. But material providers, energy, and industrial stocks are rallying. That suggests the early part of a recovery after a recession, when output is picking up. And consumer defensive and utilities are doing great, which is a sign of a slowdown.

What might be going on? I suspect there are two sets of behaviors. Part of the behavior can be ascribed to macro-economic movements and part can be ascribed to idiosyncratic movements. Idiosyncratic is really a short-hand way to say the fish is swimming upstream for a different reason than the current is moving the rest of the fish down stream. I think, in part because the yield curve may be flattening, that the market is anticipating an economic pullback.

That explains the behavior that utilities, financials, consumer cyclicals, consumer defensives, technology, and communication services are exhibiting. I think any strength in technology is coming from the AI bubble. The AI bubble is powering some of the industrials, along with a re-arming of Europe and a possible expansion of the defense spending. The policy chaos and dollar de-risking explain energy prices and basic materials. If the dollar de-values, then the price of commodities and energy will increase for American consumers. If the dollar falls, without doing anything, Exxon Mobile (XOM), Chevron (CVX), etc. will make a lot of money. As will miners.

So here’s the score card. The long term bet being made by most investors appears to be for a weaker economy. That’s not certain. They can be wrong. But that’s what most of the sectors are telling me. (And therefore I could be wrong). My confirmation is that maybe the yield curve is flattening. (But I could be wrong). The dollar is expected to weaken (as per official US policy), and falling interest rates will further weaken the dollar beyond the chaos that is driving countries away from the dollar. That means energy and basic materials have a tail wind. Until such time as we demand less energy because economic activity slows down, and even then we could see prices increasing on net.

Anyway, that’s how I square the circle.


And this is not investing or investment advice to you, or anyone. It’s is provided for your entertainment purposes only. And if you are investing, contact a professional before making any decisions. Buying and selling stocks, futures, or any investment is a risky activity and can cause you to lose money, including the principal which you invest.

A Little Perspective

NVDA is going to announce earnings on Feb. 25. Like everyone else, I think I’m more interested in the forward guidance on sales than sales over the last quarter. I think we’re all looking for an indication of any pull-back in AI capex spending. This would not just be an issue for Nvidia, but also for companies ranging from turbine generator suppliers to utility and real estate companies. Looking at current levels for the NASDAQ, the recent high was about 26,000. A historically normal bear market pull back takes us to just under 21,000. That’s at the bottom end of a congestion area from last December. The S&P 500’s recent high was just above 7,000, meaning it’s 20% retracement is in the 5,600 ballpark.

The difference between a regular bear market pullback, that cleans out some of the deadwood, and something bigger is only visible in the rear view mirror. When the stock market started dipping before the GFC, a lot of people thought this is just about clearing some deadwood from the system. Once it’s done, the infinite money glitch will restart. Jim Cramer gets a lot of shit for the “Buy Bear Stearns” call just before it went tits up. But he wasn’t the only one who genuinely believed Bear Stearns was in a bind but would find its way out. In part because they didn’t have all the information necessary to make that call. They did not know what Bear and its counter-parties knew. They have opinions on dozens of individual stocks and are not specialists who follow just one company. As Bear kept dipping, they thought it was time to buy. The bias sell side analysts have toward buying just made them look that much dopier when it happened.

Contrast what happened with the sharp pullback and return during the start of the COVID lockdown. The S&P 500 went from almost 3,400 to 2,200, well over 20% and came back fairly quickly. In six months it was pushing new highs as we sat around swimming pools, masks on, glaring at the neighbor jogging by without their mask. Okay, that was one stock versus a whole market, but after the 1929 crash, the stock market came back in what’s called a bull trap. Price came back, people bought in, and then resumed their slide. In fact, the prices came back to nearly the 1929 top.

I don’t know, Jim Cramer doesn’t know, and no one knows if Nvidia’s earnings announcement will cause investors to double down, pull back, or continue to waffle in the trading range. Or pull back for a couple of months, come down 20%, and then come back. As Yogi Berra said, predictions are hard, especially about the future.

But it’s good to clear out the deadwood. For example, the zero days till expiration options trading may be contributing nothing more than volume, income for brokers, and some volatility. I would say it would be nice to wash those folks out of the market, but I suspect a majority are not professional traders. They think they are, but they’re just gambling on whatever free broker they’re using. It would also be nice to nip the prediction markets betting on the market in the bud. But again, that’s not done by people whose wealth moves by six or seven figures on a daily basis. It’s done by people who can’t replace their fridge, if it breaks.

But then again, other than time horizon and belief, what makes someone betting Tesla will move up at least half a percent today, different from me? I have a longer timeline. And for the last 100 years, we’ve seen the US economy grow and wealth accumulate in assets like stocks. Over a long enough time-line (with an important asterisk there about when you buy in and when you cash out), people have generally done well. But we wouldn’t be the first example of a country killing its golden goose for the dumbest of reasons. London has played second fiddle to New York for some time, but Brexit has accelerated its trajectory into irrelevance. Now, its best financial innovation is possibly loosening laws to become more like Dubai, where it’s anything goes (including fraud). Once, even after the US economy eclipsed the British Empire, London was the financial and insurance center of the world.

At some point, the hyper-scalers will need to stop buying Nvidia hardware unless they figure out profits from AI. The market is already giving Google, Amazon, and Microsoft the side eye for heavy capital spending to support AI. The punishment by the street for not investing in AI might be worse right now. But at some point, if AI isn’t making real money (and not just redeeming credits issued in exchange for ownership in Open AI or Anthropic), money spent on AI chips or data centers would be better used to buy back stock. At that point Pinchai, Nadella, and Jassy might decide to stop advertising their AI capex spend, as it would be driving down the stock, and focus on “core competency.” They will pivot by laying off a bunch of people and fucking over a bunch of contractors who anticipated the completion of additional data centers. Oh well. Somewhere between now and that possibly distant future, I expect to break Nvidia to break down from its trading range. Unless it doesn’t.


This is not investing or investment advice to you, or anyone. It’s is provided for your entertainment purposes only. And if you are investing, contact a professional before making any decisions. Buying and selling stocks, futures, or any investment is a risky activity and can cause you to lose money, including the principal which you invest.

On Tap for This Week

This week is a lighter week.

  • Monday – Markets are closed
  • Wednesday – Housing starts and FOMC minutes
  • Friday – GDP

Housing starts I don’t think are as critical as they once were. It used to be that sales of houses were tied to a lot of other economic activity from buying new furniture to updates to existing homes. It used to be more a headline number and market mover.

Here we see the last couple years of starts, compared to the historical numbers for housing starts. Although housing remains unaffordable for many, we don’t see a huge increase in starts over the last three years. From the chart above, we can see a jump shortly after the COVID lockdowns, but nowhere near enough of a bump to deal with the lack of housing created after 2008. And if you have to ultra-stretch your budget for a house, that doesn’t leave a lot for new furniture or trips to Home Depot.

The FOMC minutes, however, will be interesting to see. We’ll get a view of how hawkish or dovish the over-all committee is. And remember, even if Trump installs a rate-cut happy lunatic as Fed chair, that lunatic doesn’t set policy. It’s voted on by the full committee. Which is why Trump is testing his ability to fire other Fed members. In the presence of tax cuts and proposed spending increases, a Fed that cuts rates will be adding stimulus on top of stimulus when the employment rate is in the range of full employment. Which would attack the debt level by devaluing the dollars in which the debt had been issued. But then interest rates (should) climb, or the dollar (should) fall to offset the devaluation of the dollar. When the dollar falls, oil and other commodities climb in price, pushing more inflation. And there is no guarantee that the increase in wages would outpace inflation. We would almost certainly all be worse off.


A quick note for folks that think 0% unemployment is full employment, that’s not how it works. Inflation has a statistical relationship with unemployment known as the Philips curve. Below a certain level, like 7% unemployment, a decrease of 1 percentage point of employment has no impact on inflation. At lower levels of unemployment, a 1 percentage point decrease in unemployment drives higher inflation. Why? Because when the labor market gets tighter (and everyone is immediately swept up into a new job), companies wind up bidding up wages to attract workers.

Those workers have more money for cars, food, vacations, and so on, and that drives inflation from the demand side. Also, as wages get bid up, more workers come off the sidelines into the workforce. These range from moms who no longer see it economical to stay at home, or retired people seeing opportunities, or people who left the job market to write a cook-book, etc. You can get a month to month increase in unemployment as these people come back into the workforce, while having a very tight labor market. As we pushed down toward 3% unemployment post-COVID, that contributed to an increase in inflation. It was great because everyone’s salary was jumping, but few people feel it outpaced the impact from inflation.

A Not So Quick Note on Jobs Report

The fun thing about the jobs report is re-interpreting it to better suit your political leanings. “Yes, but they’re not good jobs.” Estimates were in the 70k ballpark and the number came in at 130k. There was also slight wage inflation. This makes a rate cut less likely in the next few months, Warsh or no Warsh. The bulk of the jobs came in health care and education, with the government losing jobs. We’ve been assuming that the interest rates have been a drag on the jobs market but the economy may have adjusted to having any number other than zero as an interest rate. In fact, there’s a case for an interest rate increase in the coming year.

  1. The last mile on inflation is sticky, which may mean rates are not high enough.
  2. If the economy is expanding and pushing up wages at 3.5% funds rate, the neutral rate may be higher.
  3. Inflation may accelerate if GDP continues at its current clip and wage pressure continues to rise.
  4. Aggressive spending (like a 45% increase in the DoD budget) may fuel more inflation.

But here’s the thing. Don’t read too much into one report. Next month could surprise down by 50k. Who knows why – there are some long-standing data collection issues. The numbers will bounce around, especially as they get revised. There’s the table of year end revisions to the 2025 reports and it’s illuminating.

We created (revised) 181k jobs net last year. Maybe the yardstick of over 100k per month for a growing economy doesn’t make sense in a country that may start to experience population declines (as we shut off the immigration flows). That’s been the number I’ve used to evaluate jobs reports, but net migration to the US (by policy) is intended to be zero. We’re not fucking enough to make enough new kids. In fact, if the population isn’t growing, and it’s just aging. Wouldn’t slight job losses, but more jobs concentrated in healthcare, be a good jobs report? Maybe the yardstick should be net zero jobs near full employment? And only shrinking and growing during recession or post-recession recovery?

As I think about this, I start to think about the elasticity of wages with respect to growth. Once we push up against full employment, wages need to rise to get more workers into the job market. How much do wages need to rise once we get more workers into the job market? If we go from 4.3% unemployment to 4% unemployment (very low, historically), do we see wages shoot up enough to drive inflation? But if we get not much more slack than 4.5%, do we see wages falling? That would suggest wages are inelastic with respect to employment near full employment. I suspect the same isn’t true in a recession, if unemployment spikes to 7% or 8%, and much smaller (if any) increase in wages are needed to bring down unemployment. We go from having a Philips curve to a Philips hockey-stick.

It also has some implications on growth. A shrinking population suggests that growth that’s slightly too fast results in inflation. With a growing population, part of growth simply goes to absorbing new workers. You need to grow, otherwise you quickly accumulate large masses of unemployed people. And I suspect it favors younger, less experienced workers, as you can hire more of them to replace older workers. They are cheaper and plenty of them. But what if a shrinking population size makes you risk averse, preferring to stay with proven workers rather than bringing in new, lower return, unproven workers from a smaller (and therefore not much cheaper) pool? Maybe that’s why Europe has had a persistent youth unemployment problem?

Hear me out on this brain fart. In a fixed population (or shrinking population), you basically trade one worker for another. When Bob retires, Alice steps in. You knew what to expect with Bob. Bob was very well trained. In Bob’s cohort, unemployment is like 2%. To balance that, in Alice’s cohort, unemployment needs to be higher, say 10%, so on average, we have that magic non-inflationary level of unemployment. But Bob is old and Alice is young. Alice would be much cheaper, if we had a larger pool of Alices than Bobs.

But there aren’t a ton of Alices sitting at home, vaping and playing Call of Duty. Alice is a risk. You could bring in Alice, train Alice, and then lose Alice as she’s offered a better job by your competitor. In addition to the fact you need (say) 1.5 Alices to equal one Bob until Alice gets a few years of experience. Whereas they are not likely to poach Bob, and Bob would probably not get a better deal if he moved. You have an incentive to hold on to Bob and only hire Alice, if Bob leaves. And if one Bob leaves, a slightly younger Bob would be preferable.

Once Alice’s cohort comes into jobs, their unemployment also drops to some low number. But in order for that to work, the unemployment among new workers has to stay fairly high. Maybe I just made a realization labor economists have known for years. In any case, I think we’re going to have to get used to flat jobs reports and more of our workforce moving into healthcare. Otherwise you wind up with inflation pressure and Boomers dying on the side of the road.

Another Look at Nvidia

This is not investment or investing advice. It is for entertainment purposes only. Contact your investment or tax professional before making any investment decisions.

A couple of days ago I took a look at Nvidia, to kind of show how I look at where the stock is headed. I actually prefer to buy ETFs or funds than stocks, but I do buy some individual stocks. And some of what I say is also applicable to those funds and ETFs. Although you have to look at them individual and figure out if the ETF or fund matches your objectives. I learned this early on when I bought into some funds to see the sector outperform the fund, only to realize the weighting the fund used wasn’t what I expected.

I use the term support line, but I think of it as more of an area. It’s not that buyers come into the market at 170.95 and lift the price. It’s more that when the stock gets to that price, various people are stepping in to buy. And I use the term people here very loosely. It is a combination of ETFs and funds, along with large institutional investors. It used to be that lunch time on say, Wednesday, you could actually put in a trade that would move a sock price. But I don’t think that’s true any more, mostly because trading volumes are much larger.

Anyway, once prices hit a certain zone, buyers seem to step in and keep the price from falling. It may only be a pause on its way to lower levels. Most support lines are found buy simply eye-balling where a series of lows caused the price action to reverse. It may have dropped below that level for a bit, but quickly comes back up. When the price action drops to the support and comes back up that’s called “testing” a support and the more that happens, the more significant the support area becomes. I picked 171 because I see the price approaching that area multiple times and bouncing back. I don’t think exact numbers are particularly useful.

But the whole market is taking a breather in the morning pre-market session. Nvidia (NVDA) is part of the NASDAQ composite index. (Don’t ask me what NASDAQ stands for). It is a significant part of the index, so it’s behavior will impact the broader index behavior. To me there’s a support area extending from about 600 to 585. (This is the QQQ, which is the cash index for the NASDAQ 100). I view the support areas to be less precise on the cash index because it is the byproduct of a lot of buying and selling, both through the index and its individual components. The line on top is not a support line, it’s a resistance line that suggests most market participants decide anything above 630 drives selling.

The chart of the cash index is different from what most people look at when they look at the NASDAQ, they look at the futures market, as shown below. It is not the product of buying and selling stocks. It is the the prices of the futures market for the index. A different thing is being traded. In the futures market, we see a gap that doesn’t exist on the cash index, and the prices look almost, but not quite, the same.

On the chart of the NASDAQ futures, I see a similar support area but I think they’re actually two support lines. There’s one at 24,937 (remember – not exact) and one at 24,289 (not exact). Remember, I eye-balled the lines and read the price from there. I didn’t pick the price and draw the line. We ploughed right through the first line (which probably means it wasn’t really an area of support). And today, the pre-market is bouncing off the second line, meaning it’s holding. That second line is formed on the basis of it being the bottom of the gap (which was eventually filled). But again, it’s more that zone around 24,289 where a mix of funds, algorithms, and large institutions will see a buying opportunity.

Looking at the S&P 500 Futures I’ve identified what I think is a trend channel. We see a failure to make a higher high at the end of the channel, and a break down from the channel (which we won’t know is significant until we’ve had more than a couple of days trading lower). And we briefly pushed into what I think is a support area. The support area holding means going lower will be a challenge, but the other factors are bearish. (Meaning there’s more interest in selling). But this is just to show the broader market is pausing at some level of support.

To be honest, I have no earthly idea what makes a large fund decide the prices to buy or sell NVDA or the other components of the NASDAQ, a NASDAQ future, or any stock. Maybe they just think we’ve come too far these last couple of days and they’re buying the dip. Maybe it’s just selling or buying to offset options contracts. I really don’t know. And no one knows, except for one thing that investors made clear with Google yesterday and AWS today. They are no longer looking at hundreds of billions of AI investment as paving roads for future growth. They’re looking at it as burning money that may not come back. And because many investors (both small and institutional) use baskets of stocks (like ETFs), stocks are now more likely to move similarly than before.

To wrap this up, I wrote this to clarify my thinking on what’s going on with the market. To remind myself, that even though I drew a line, It should have been a fuzzy, broad line, not a precise, skinny one at a specific number. I also like to see what the giant ball of money is doing today. It’s sloshing away from defensive investments, like consumer staples, and back to risk and tech, now that we had a big move away. That money sloshes back and forth, back and forth, each time allowing the smart money to bleed more and more off retail investors.

And this is not investing or investment advice to you, or anyone. It’s is provided for your entertainment purposes only. And if you are investing, contact a professional before making any decisions. Buying and selling stocks, futures, or any investment is a risky activity and can cause you to lose money, including the principal which you invest.

[Update] The screen shots above are from the pre-market session. The regular session can look a little different, for example, here’s NVDA, note the slightly different representation of today’s candlestick. Which is also a reminder that what you see may be determined by the conditions under which the prices were collected.

Thinking Through NVDA

With the normal disclaimer that this does not constitute investment advice, it is provided purely for entertainment purposes, and contact a tax or investment professional before making any investment decisions, I’ll take a look at a stock.

Taking a look at Nvidia, we see the 50 day moving average peaked in December and has started a flat to modestly downward trend (yellow line is an eyeball of the trend). The price is approaching the 200 day moving average (orange circle). There is a floor around 170. So what events would I look at, from a technical perspective?

If the price drops below the support at 170, that is significant. In my thinking it’s more impactful than the price falling below the 200 day moving average. The 200 day average is going to continue to move up, even if the price declines, as it catches up to the historical price action. The violation of support that has been in place since September is more critical, in my opinion. As would as a steeper downward slope on the 50 day moving average.

Technical analysis isn’t just tea leaves for investment bros, if you look at it as a pattern of the expression of sentiment about a stock. What do we know about the broader context? For one thing, the current administration has shown a willingness to step in and make decisions that impact Nvidia’s sales. Second, the broader investment community is getting more concerned about circular deals. Third, investors are starting to ask where’s the beef on AI revenue. In the past, when the price has approached 170, buyers came in because they saw value in the stock. Above 190, more people did not see the value in the stock and sold. That range indicates people may be waiting for more information before making a move.

As we can see, all the revenue bump for Nvidia has been in AI accelerators. I’m assuming there’s a role for LLM style AI in the future. If anything, it makes sense for Microsoft to include it in Office to help with writing e-mails, writing Word docs, Spreadsheets, and Presentations. Likewise, Google’s office offerings would benefit. As would ad generation on Meta. The question is if the amount that needs to be spent in accelerators, data centers, and energy makes sense, given the revenue it produces. If it costs Meta $10 of cap-ex and $10 of lifetime energy costs to generate a lifetime revenue impact less than $20, it clearly doesn’t make sense.

What would happen to Nvidia if the GPU sales are cut in half. First, the multiple needs to come down because the expected future growth in sales is at a much lower sales volume. Let’s say it drops to 20 times earnings. Earnings are cut in half. That would mean a share price of around $45 for Nvidia. What does that do to the mag 7? Well, different parts of the Mag 7 are there for different reasons. Apple is not there because of AI sales. Microsoft, Amazon, Google, and Meta have AI exposure but won’t get destroyed. Tesla is a meme stock so this may not change anything for people who believe humanoid robots are a 10 trillion dollar TAM. But there are other stocks, like Oracle, Micron, and Broadcom that take a big gut-punch. (As is happening as I write this).

What may have an outsized impact is the wealth effect that’s given the top 10% to float half of all consumer spending. A drop in the Mag 7 would pull down the entire S&P 500. But it also flips psychology. It would also have an unquantifiable but negative impact on the private equity and banks that have lent money to AI startups and data center build outs. One estimate puts 20% of PE’s loan book on AI related loans. No bueno. Not to mention the hit to all sorts of venture funds and the investors in those funds.

Again, do your own research, consult a professional, this is only provided for entertainment purposes, and is not investment advice.

I Was Not Alone and ADP

I think I was not alone yesterday in looking at the big blob of money wandering around. At one point it looked like the market was going to be broadly down, because the options are depressing. As the blob of money lumbers out of tech and into not tech, valuations wind up rich, especially given rates. Here’s a way to look at it. Take a company that has about a 3% real long term return through a combination of price appreciation and re-invested dividends. I say “real” to mean inflation adjusted. That means every 24 years, or so, you double your money in real terms. The nominal (or not inflation adjusted) rate of return might be 5% (assuming a 2% rate of inflation).

You could also buy bonds, which might be paying 2% in real terms. (The nominal rate is 4% but there’s 2% inflation). If you reinvest the dividend, you double your money in real terms in 36 years. But the bond is considered near zero risk (given the time horizon) while the stock may or may not pan out. Even a very stable business with a simple and straightforward revenue model may not survive all 24 years. Or, like GM, it may stumble repeatedly. 10 years of bad management and shrinking margins may seriously undermine your 24 year plan. The stock has more risk than the bond (which does have interest rate and reinvestment risk – but we’re eliminating interest rate risk by holding to maturity and assume the the reinvestment risk averages to zero over 36 years).

One way to look at the double your money equation is to say you bought the company for cash, today. Every share. How long would it take to make that money back? Well, your money doubles, in real terms, in 24 years. That means it will take 24 years to make your money back. The company earnings are what provide the price appreciation and dividends (although stock buy-backs are seen by stupid investors as more tax efficient). So how much would you pay for one year of that company’s earnings? It’s simple, 24 times. At that rate you should have accumulated enough to buy the company outright in real terms.

That leads to a fairly simple model of how to anticipate the change in value of the company, given the interest rate. If the nominal interest rate goes down to 3% (but holding inflation at 2%), then we would be willing to pay more for that company. Why? Because it would now take 72 years to double our money with the bond versus 24 years for the company. While the company has more risk, it is is more attractive and we would be willing to pay maybe 36 times earnings. We’re taking higher risk, but more reward than the zero risk option. Likewise, if nominal interest rates go up to 5%, and it now takes us only 24 years to double our money with bonds, the company looks less attractive. It’s worth maybe 12 times earnings, for the given level of risk.

That’s the “perfect world,” thought experiment view of valuing a company. The giant ball of money screws with that by suddenly injecting a ton of buying into that company. CNBC and influencers talk about the massive run up in the company. Other idiots then try to follow the trend. That company should be trading 24 times earnings long term, but the ball of money pushes it to 30 and the idiots help drive it to 35. Retail investors get sucked in because “this time it’s different.” Retail investors are left holding the back when the ball of money chases the new shiny thing. The smart money that owns much of the ball gets out at 35. Retail investors ride it down from 35 times earnings to some over-correction down to 18 time earnings, essentially turning over their wealth to the great ball of money.

Which brings us to the ADP report. Is the ADP report an accurate gauge of employment. Not especially. It is a little erratic. But if we look at it over the last few months, we see it’s trending down. And most of the delta between the expected value and the reported value surprised to the down side. The former is consistent with a slowing job market hypothesis and the latter is consistent with most professionals being over-optimistic about conditions. But the picture is cloudy, not clear. We have the Schrodinger’s job market, that’s both good and bad at the same time depending on which number you look at. And that also feeds in to conflicting data, such as manufacturing in the US expanding, but not manufacturing employment.

There is no one number that tells you how the economy is doing. There is no set of numbers that tell you how the economy is doing. In truth, we’ve had a lot of change and I think some numbers, like first time unemployment claims, are no longer indicative of much. While I used to write off ADP as only useful to get journalists on TV hot and bothered when it dropped a wild number, the government jobs number has had a series of issues with major restatements. Companies (for whatever reason – but in this day and age it could be ideological) are failing to report on time, requiring the economists to produce a less accurate estimate. It has never felt so hard to get a bead on the economy.

[Update] Services PMI came in as inflationary to me. Although employment continues to grow in services (which is much larger than manufacturing). New orders are still growing, but slower.

The Great Ball of Money Lurches Away from Tech

This morning, as I shake my head at the lack of JOLTS data from the BLS, I watch the great ball of money lurch from Tech to not-Tech, like staples. Unfortunately, the multiples for many consumer staples companies are already on the high side of normal. For example, PG is at 23, which represents confidence in what is essentially a flat business. Unlike the mythical tech company (and I say mythical with great intention), PG and the other staples are businesses that are both stable, with low but predictable margins, and scale linearly. If they take a little market share this year in one category, it doesn’t mean winner take all. They don’t have 40% ore more margin products. There is no network effect around dish soap.

I have a number I think of when I look at a fair valuation for Nvidia (hint – it’s much lower than it is now). And while I look at AI as having merit, my arguments relate to how much do you want to pay for the productivity. In my own field that productivity is mixed and sometimes requires you to ignore quality. But right now investors are heavily subsidizing AI for consumers and businesses. The question of how much a company would have to charge for a sustainable AI service is open for discussion. We may have a gentle deflation out of Tech but it may mean that PG winds up at a PE of 30? Or maybe 35? That’s a little rich. Because the big ball of money doesn’t know where to go so it just keeps buying and selling.

The impact the draw down on Tech is having is an advance decline ratio of roughly 6:4 (meaning out of 10 random stocks six are up and four are down), but the NASDAQ and SP500 are down. The DOW is treading water, but the Russel 2k is up. People are looking to higher-risk, smaller stocks. As I look at that, the big ball of money is pushing into not-Tech with industrials, consumer cyclicals, and basic materials punching up. That’s in line with the data suggested by yesterday’s ISM – that low inventories are going to drive up production.

It seems like there’s more money sloshing around than value to absorb that money. It’s not floating around in the economy as money to spend (other than through the wealth effect). So it’s not growing anything. It’s sloshing around inside markets, driving growth through multiple-expansion, drafting in more money as people look at the number go up and want to join in. All of which, I’m afraid, makes this gambling more than investing. Jump on the band-wagon, ride it up and then bail before the hammer comes down. But you better get in now, otherwise you’ll only get in at a higher valuation in the catch-up trade and have less runway.

The big ball of money will concentrate into a smaller and smaller chunk of the economy as it sloshes around. With dumber money getting swept up by smarter money. Assuming we just plod along for another couple of years and look for articles that say the top 5% are 50% of spending. Only at those levels they don’t go out to eat more, they just buy $25,000 pizza ovens for their $750,000 kitchen remodel. So the economy will look weird as McDonalds, Walmart, and Target struggle, as household consumer names lurch in and out of bankruptcy and private equity, while Porsche and Rolls Royce are making book. GDP is up. The market is up. But the bottom 80% are just fucked. And you can’t have a democracy when the bottom 80% feel like they’re getting the shaft and locked out of number go up.

How to Weaponize Your Own Mess

What links the working class elements of Brexit and anti-globalist American right is a belief the world order has exploited them. The messaging and thinking isn’t precise, because these are not informed opinions. David Ricardo has been right for the last 211 years, from 1815 to today. Trade makes both countries wealthier. What Ricardo didn’t say is how that wealth would be distributed (although I think he assumed it would be a broad lift in living standards). Also implicit in the reasoning around trades is that other aspects like environmental or human rights protections would be respected. In the ideal view, one country doesn’t become the efficient supplier of a good because it’s willing to work enslaved people to death in toxic conditions.

There’s an old economics joke. Stick your head in a 400 degree oven and your feet in liquid hydrogen. On average, you’re fine. A lot of inequality is elided away in mass averages. It comes to light when we break these statistics into quintiles, quartiles, or the top/bottom X percent. There are are so some synthetic measures, like the Gini co-efficient for the US is 41 while 29 for Germany, while the GDP per capital in the US is about 90,000 while Germany 57,000. On a per-capita basis it’s better to be an American. But the likelihood that you share in that wealth is lower. It’s kind of like people wax poetic about medieval times but forget that in all likelihood they were a peasant working as a near slave for the feudal lord.

What has happened in the UK and the US is that the distribution of benefits from trade have not been distributed evenly. There was a belief that the system would work it out in the end. You lose your job in the industrial North of the UK or the rust-belt of the US but something else comes along. Like you leave the assembly line and start designing AI accelerator chips or turn to writing software. In fact, what was needed, was a re-distribution of wealth by the state so the benefits of globalization were more evenly distributed. By the way, the Gini coefficient for the UK is about 35.

The benefits of trade were delivered unequally, benefiting capital more than labor. That capital also became militant about not raising taxes or wealth redistribution. After all, are you advocating for class warfare by asking billionaires to pay a reasonable tax rate? Why do you want to tear society apart this way? Go back to your squalid little pens and rejoice in the social order, you troglodytes. Oh, and breed more little troglodytes because we’re running out of consumers.

It cost Bezos a mere 75 million to produce the Melania movie as a not-so-under-the-covers bribe to the Trumps. That money was found when Jeff turned his couch over and collected what fell out. That’s how much money he has. He has been a principal beneficiary of freeing trade and intends to keep every red cent he’s ever earned from it. For Microsoft or Apple to put up money for vanity projects like the destruction of the East Wing of the White House to make way for a gaudy ballroom, it is not a sacrifice. These are companies that don’t worry about millions of dollars. That is a rounding error in their day to day change in capitalization, and the personal wealth of their founders and leaders.

But… But… But… Look at the tariffs! Those are anti-trade. True, but you also need to look how they’ve been turned into a patronage system (by offering individual companies a way out in exchange for obsequiousness or out-and-out bribes), and the loopholes and exemptions lower the effective tariff rate. But for the Trump backers, it means they will pay a lot less money in taxes. If a Harris presidency might mean an extra 50 million in taxes, spending 5 million on PACs is a reasonable investment. Which is how the rich view politicians. As investments. In fact, they got a boon with Trump.

Those same people who benefited from trade. Who were the main beneficiaries of the 2008 bailout, and seemed to wind up with the lion’s share of the COVID stimulus, have weaponized far right parties to prevent any attempt at redistribution. Making people so angry they put the party of the oligarchs and plutocrats in power is a master-stroke of genius. And all the while absolutely castrating the opposition, who is just as needful of their patronage. They are like the clever player that starts the NPCs combating with one another while they watch and plunder the resulting treasure. Exploiting the lack of social cohesion, and the politicians desperate for money, keeps them in effective power and keeps their money safe.

Before you start reaching for the revolutionary pitch-forks, keep in mind that a bulk of these folks seem to survive each revolution. They are the cockroaches during upheavals. Whether it was the Russian revolution, or the French revolution, or the American revolution, a lot of these folks wind up on top. Our best bet is not revolution. It’s putting aside our emotions, our clever memes and slogans, and our sense of “team” to actually look around. Using our clear-eyed view of the world around us to vote for change. I don’t expect a lot from Mamdani, but he is the result of the ‘establishment’ left foisting an unpopular candidate that preserves the status quo. People gave the establishment left the great, big, stanky middle finger rather than support a sex pest.

Take in the world with a fresh eye. Look at the fact Amazon and many other companies benefit handsomely from trade, that trade will bring in wealth, but maybe that wealth shouldn’t be concentrated into so few hands. Look at the private equity players who purchase companies with debt, load those companies with more debt, sell them, bank their proceeds as capital gains or income, to do it all over as those companies declare bankruptcy. Minting their income through debt, massively reducing their tax burden, but in the process devastating the lives of millions of individuals. And realize they’re the ones priming the coffers of groups like the Heritage foundation.

At the end of the day, nothing changes until we change. We continue to be the NPCs screaming at each other about this or that issue, while the players sit on the sideline and laugh. Red team versus Blue team, while the green players reap the rewards. If you want any better evidence, in the first Obama administration, the democrats had both congress and the White House could have easily fixed the loophole that allows private equity partners to earn their money at a top rate of 15%. They did not. Because the private equity partners are the people the phone banks staffed by your congress person call to raise money. Now those same groups have decided their future money interests are better served in an autocracy, and they’re using the misery of millions of Americans to do that. A misery they created in the first place.