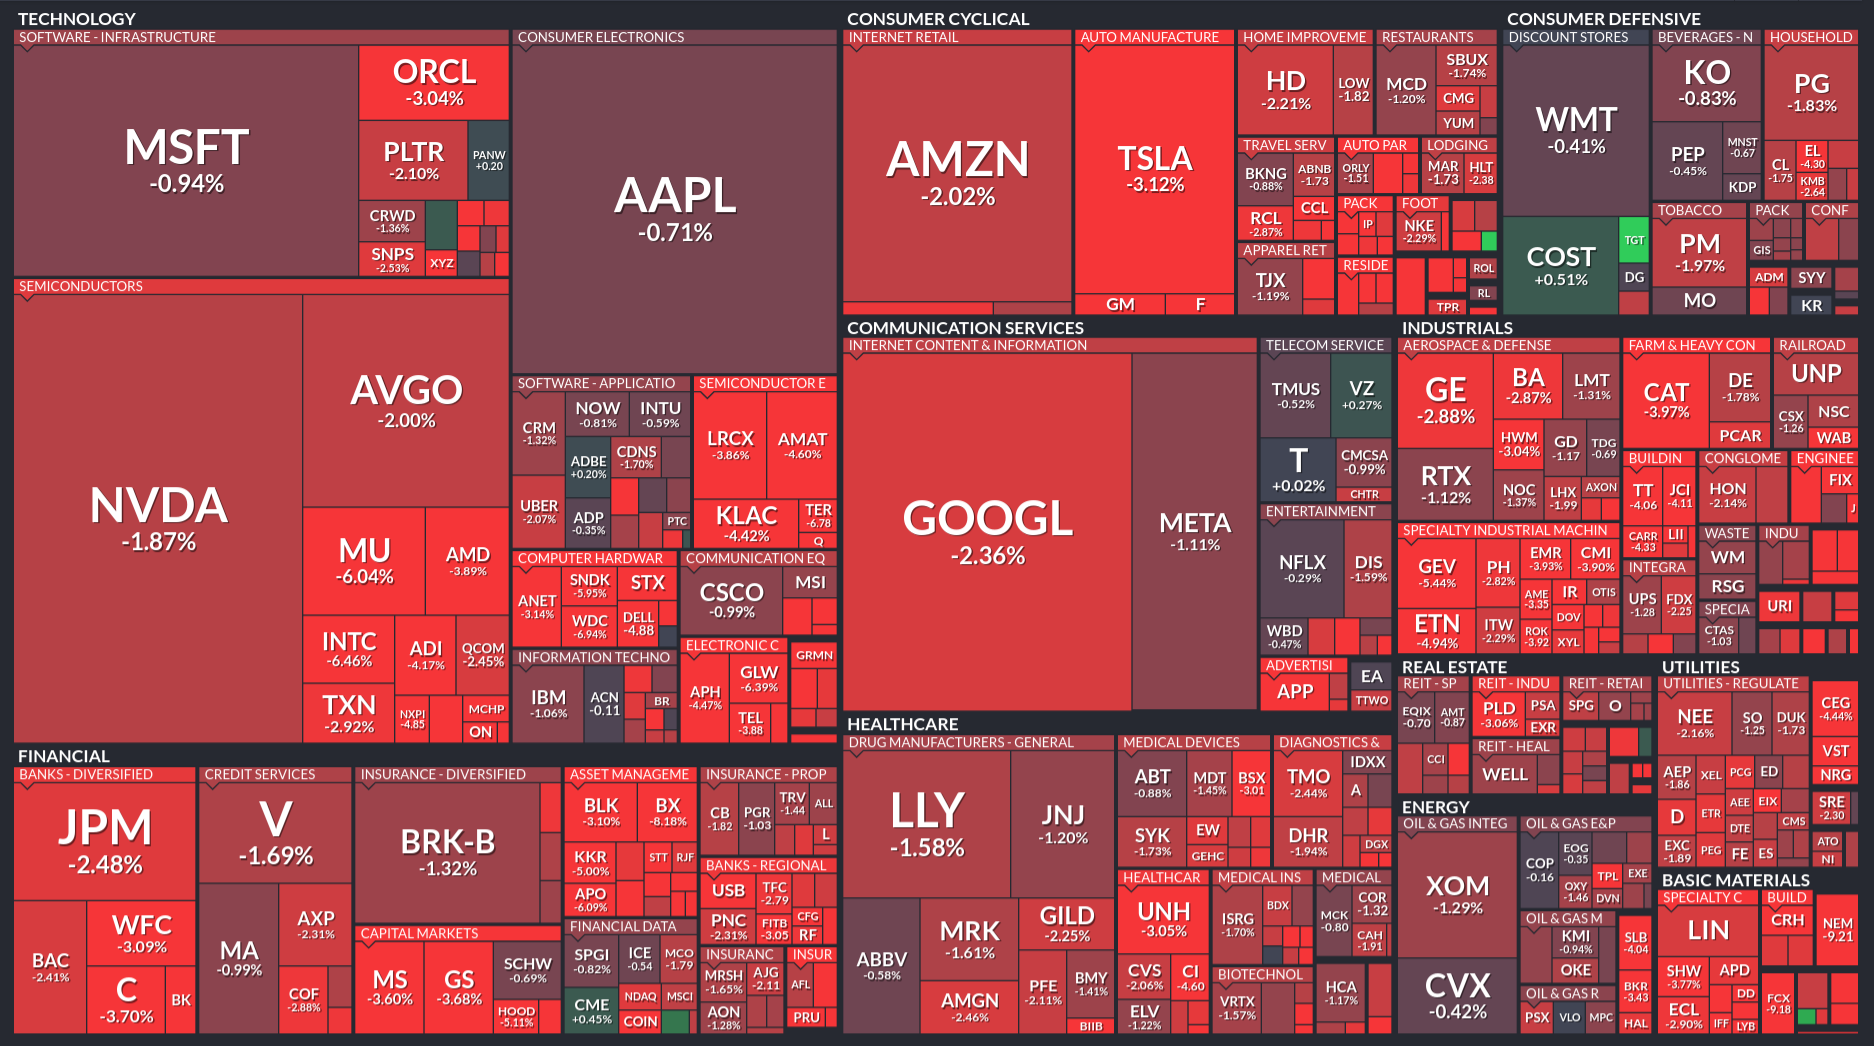
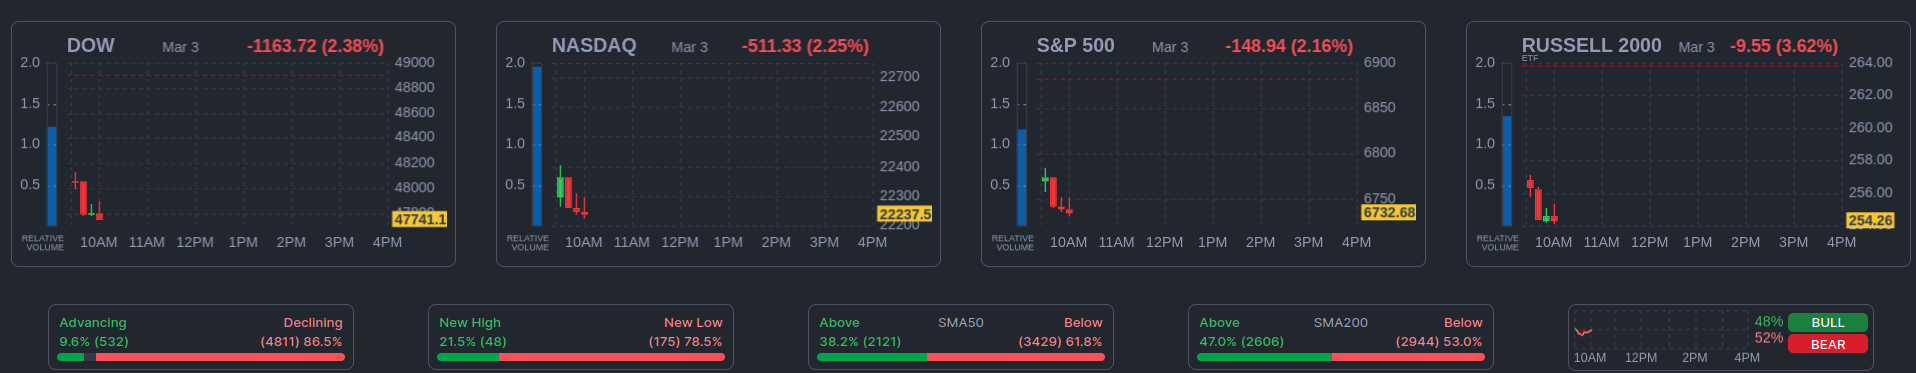
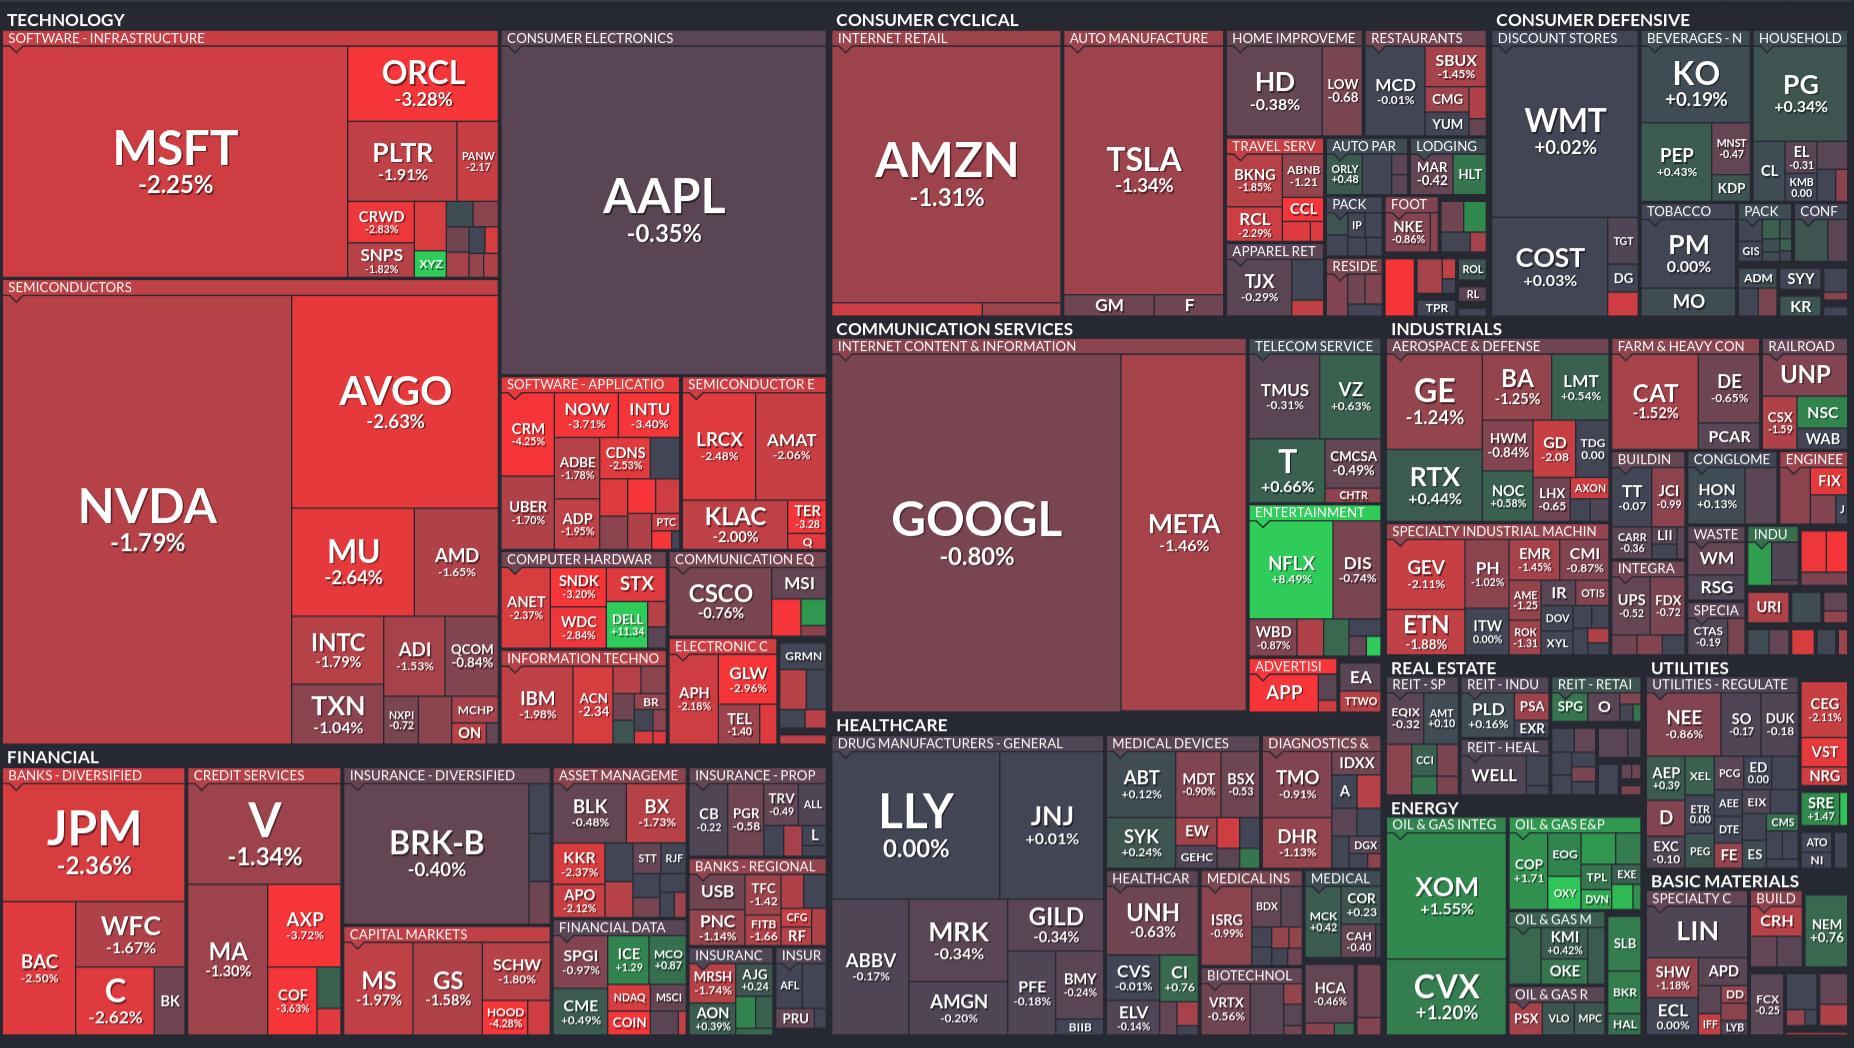
This is a “mattresses day”. And that’s what yesterday turned into. In yesterday’s pre-market I’d read the action as moving towards safety (although some odd action in bonds), but by the end of yesterday, not only were bonds down, but so was gold. This is a continuation of the “stuff the money in the mattress” approach. Money is flowing into the US but it doesn’t seem to be going anywhere. We have the market tanking while bond prices are falling. (Or interest rates rising since bond prices and rates are inverses of each other). Nothing is working except individual names, as traders view long term growth as being in jeopardy.
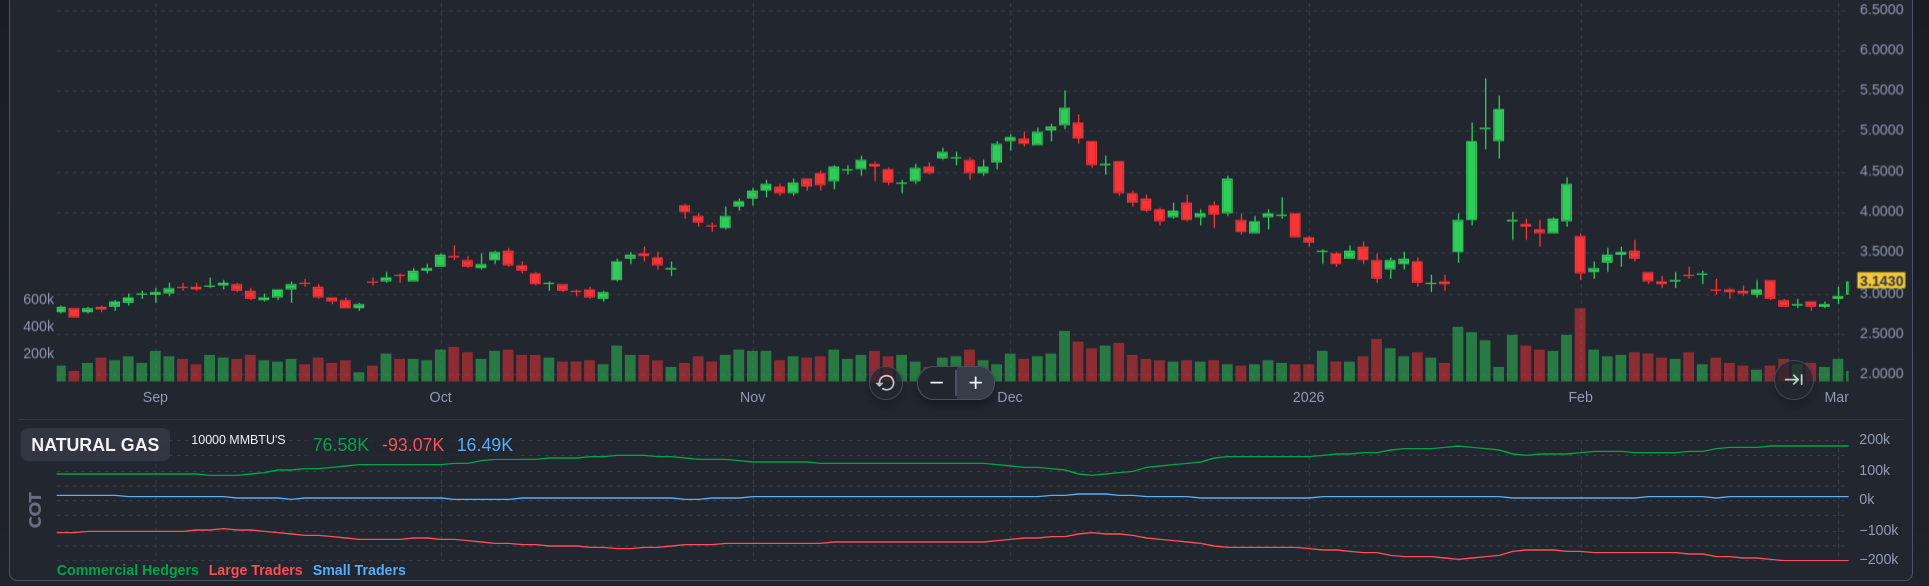
Overseas the action is even worse because gas prices as well as crude prices were moving higher. Although natural gas is down from it’s December high, it popped up about about 2.70 to 3.10 in a couple of days.
Brent Crude Price per BarrelNatural Gas
The series of events goes something like this. If the closure of the Straight of Hormuz persists, or Saudi facilities are hit, or Iranian facilities are hit, that causes fuel prices to increase. Along with Ukraine hitting Russian supplies to choke the Russian war machine. That will drive inflation, causing the Federal Reserve to raise rates (more on that in just a second), which will slow the economy. But, at the same time that’s happening, you have a slow down in the general economy. What Jamie Dimon calls the “meh” economy goes to a blah economy. And thus, you get oil-shock, 1970s, age of disco cost-push inflation at the same time you have a weak job market… STAGFLATION.
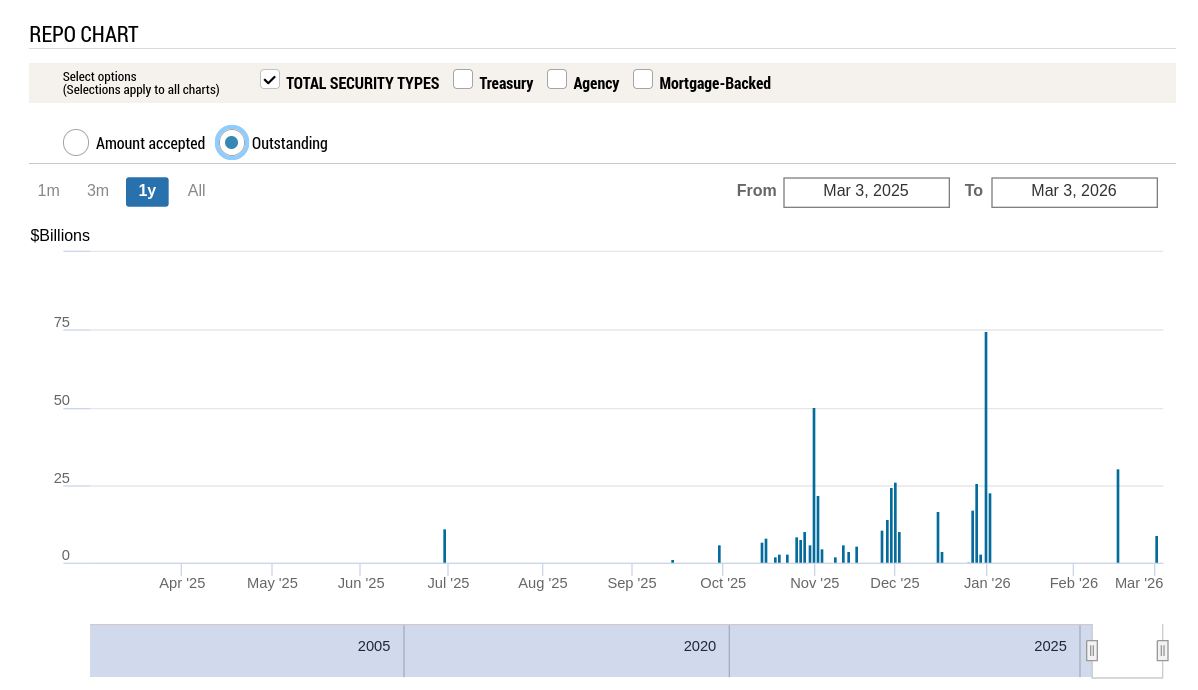
What makes me worried about the health of the credit markets (which can cause a recession just fine, all on their own), is the participation of the Fed in the Repo market. The Fed is looking for new tools beyond the Fed Funds rate and maybe adjusting liquidity may be in that toolkit. Or maybe they’re worried about the cockroach problem. Dunno. Nominally, it’s to help maintain the target Fed Funds rate.
What we may see on Friday is a “weak” payrolls number. But what also has to be kept in mind is that the US population isn’t growing. It’s flattening off and may actually shrink in 2026, as we terrorize brown people working here without papers. Or even with papers. Or even who are citizens (killing them with impunity). And it’s aging. If we have no new immigration and Gen Z ain’t gettin’ bizzy, then we will become older as the millenials push into their 40s. However, the market may react negatively to a flat, or slightly negative, jobs number, even though that keeps us at full employment.
At the end of the day, no one has a crystal ball. Trump may walk in to the situation closet at Mar-A-Lago on Friday and say “enough is enough” and bring this to a halt. He is tired of all these briefings and Pete Kegsbreath doing pushups during meetings. Or he could go for a month. (Either way he’s not going to get his fat ass over to Dover for the dignified transfer). No one knows. But the longer it goes, and the more oil prices rise, the more damage it does to the economy. The more it pushes on inflation. And more traders and investors will take new information with a negative lens, focusing more on how it adds to the problem. The result is a down market and a down economy.
I wouldn’t say every day this goes on, but every week it goes on helps push the US toward recession. And it will likely drive Europe in that direction even faster. As this impacts not just “price at the pump,” but everything from how much people are willing to take a vacation to the cost of getting a box of Wheaties to your table. On top of that, the administration is making it hard for everyone but Israel to be a US ally. Countries we need to be with us to deal with everything from economic growth to terrorism. And unlike Russia and China, who basically told Iran ‘that sucks,’ our allies have shown up for us. Whereas Netanyahu feels like he can lead us around by the nose when ever he needs a strong back and weak mind.
Taken about 8:45 AM EST in the pre-market. In short, this is the PPI coming out hot. 2.9% annual inflation versus and expected 2.6%. For the market this is as bad as, if not worse than, the CPI coming in hot. If the CPI comes in above estimates, that just means rates might rise. But if the PPI comes in hot, and the CPI doesn’t, it means margins get squeezed. It means that for a $100 of revenue, it means less profit. If both CPI and PPI were going up, that’s not good, but businesses are able to hold their margins. As happened earlier in the inflation burst, CPI went up faster than PPI in some cases, and margins expanded.
That explains some of the impact. The other part of it is the idea that AI isn’t playing out the way people hoped it would. We are seeing a concerted push by companies to adopt AI and (despite the protestations of $XYZ – Block), we have yet to see significant changes in productivity. There may be reasons for this that have nothing to do with AI. First and foremost, it’s a new technology. The “recipe” for mixing it into an organization to boost productivity and reduce costs may need to evolve. With a lot of churn, it’s hard to know if chat bots, RAG (retrieval assisted generation), or some yet undiscovered pattern will produce the best outcome. One that doesn’t give away free stuff from vending machines or cite non-existent cases in court filings. (So, how much do you want to trust an LLM to correctly categorize a major business expense that could cost you in interest an penalties?) But until we do it looks like NVidia may be the only winner as they sell more GPUs to companies that may not have the electrical grid power to turn them on?
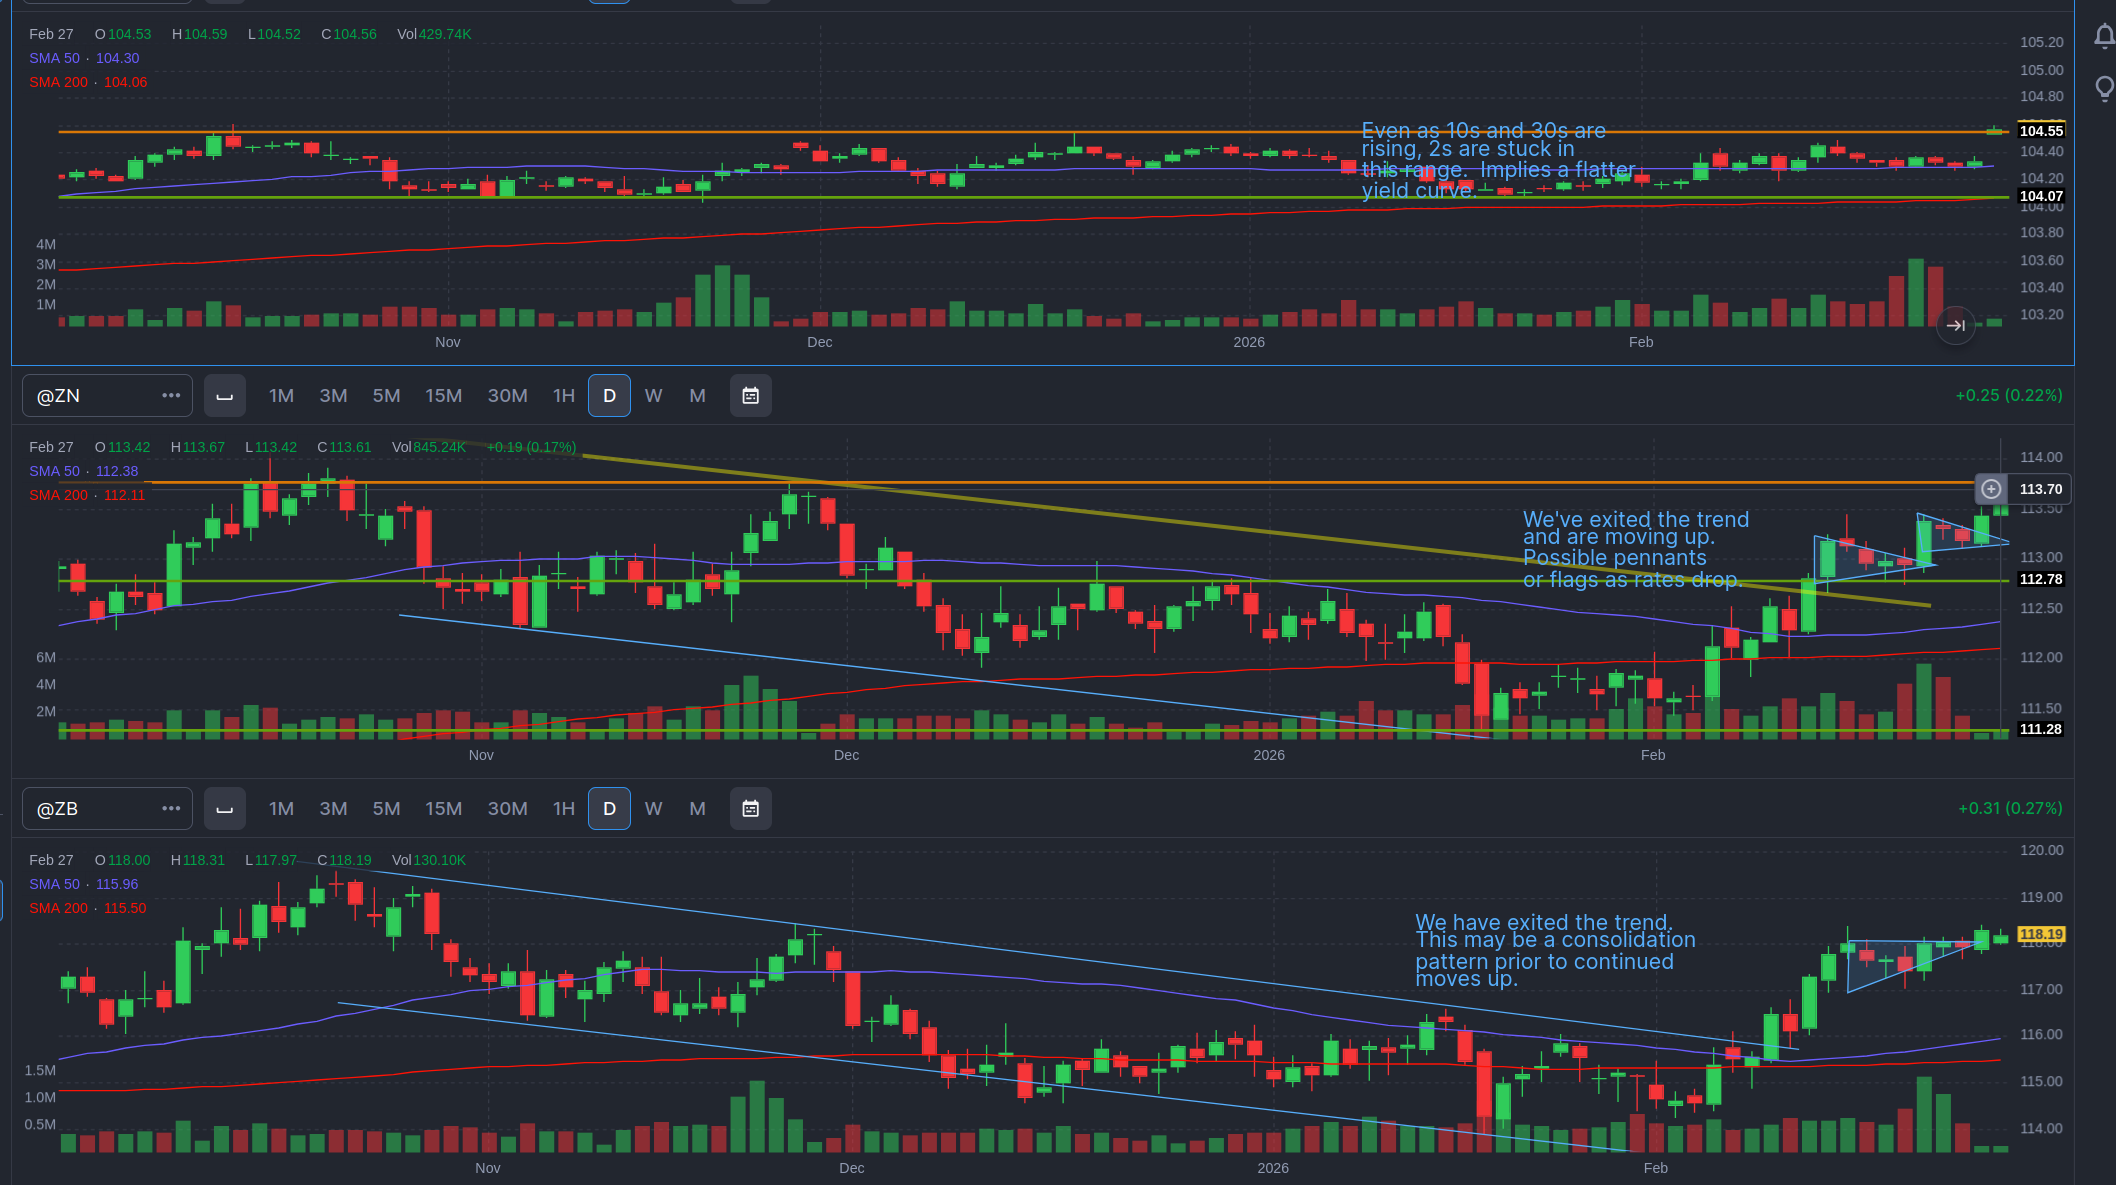
But let’s get back to macro. Long rates are dropping, but the 2-year is kind of holding in a range. These are bond price futures, meaning when they go down, interest rates go up. (The price of a bond is the inverse of the rate). The bottom two are 10 and 30 year bonds, respectively. Businesses are generally sensitive to the 10 year rate. Prices were falling on the 10 and 30 up to February, ,while the 2 year stayed in its trading range. (I kind of compressed the 2 year graph to give a better sense of how little movement there was in the 2-year, given a similar $3 range in the 10 year). The fact that long bond prices were going down, while shorter term maturities were stuck, meant that long rates were coming down while short rates were holding. (The shorter you go the closer you track the Fed Funds rate).
A normal yield curve has the lowest rates for the shortest maturity debt. Everything beyond that carries more risk. These risks may be interest rate risks (the interest rate falls and so the price of your bond falls), or re-investment risk (the rates go down and you can’t re-invest at the same rate). There’s almost no risk at 30 days to 90 days. At thirty years, there’s almost a certainty things will be different and you might be underwater in your bonds or unable to secure a similar rate when the principal redeemed. The price of the bond is a negotiation between buyers and sellers about future interest rate risks.
When the price of long bonds start going up, it means that people are betting future rates are going to be lower. This is because they expect lower demand for capital in the future – likely because the economy is slowing. A rate inversion, when the rate on the long bond falls below the short rates, is a sign investors expect the economy to be in recession so rates will be reduced to stimulate the economy. That’s why we get yield inversions, and why they tend to be at the start of, or just in front of a recession. Also, in most cases, the short term rates go up because the Fed has been slowing the economy. This last inversion period was both large in scope and did not result in a recession, so far1. (And there won’t be as much borrowing to invest in new businesses). What you want to see is the entire yield curve (the interest rates at various maturities) move down together. Lower rates plus strong future expectations.
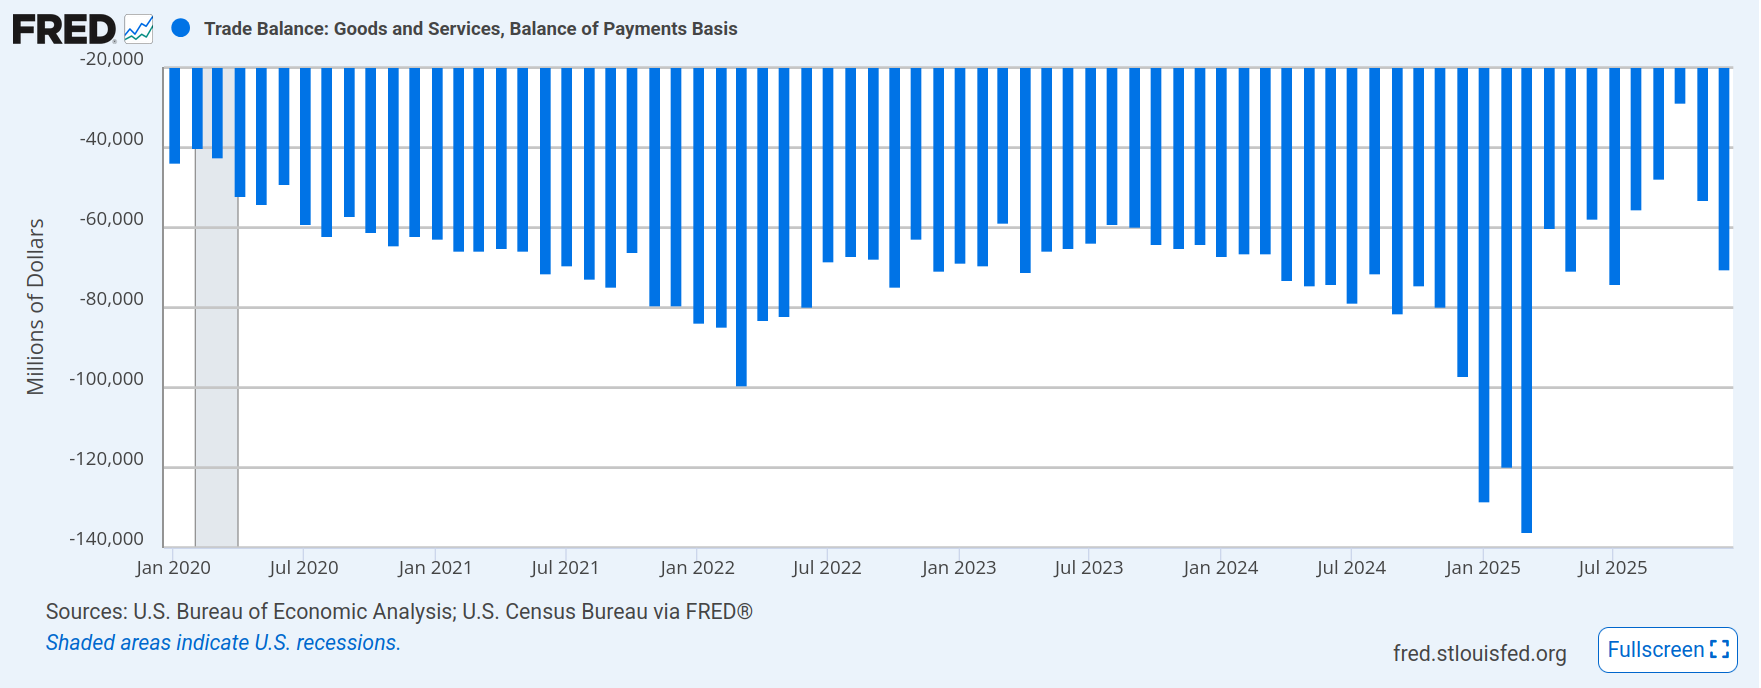
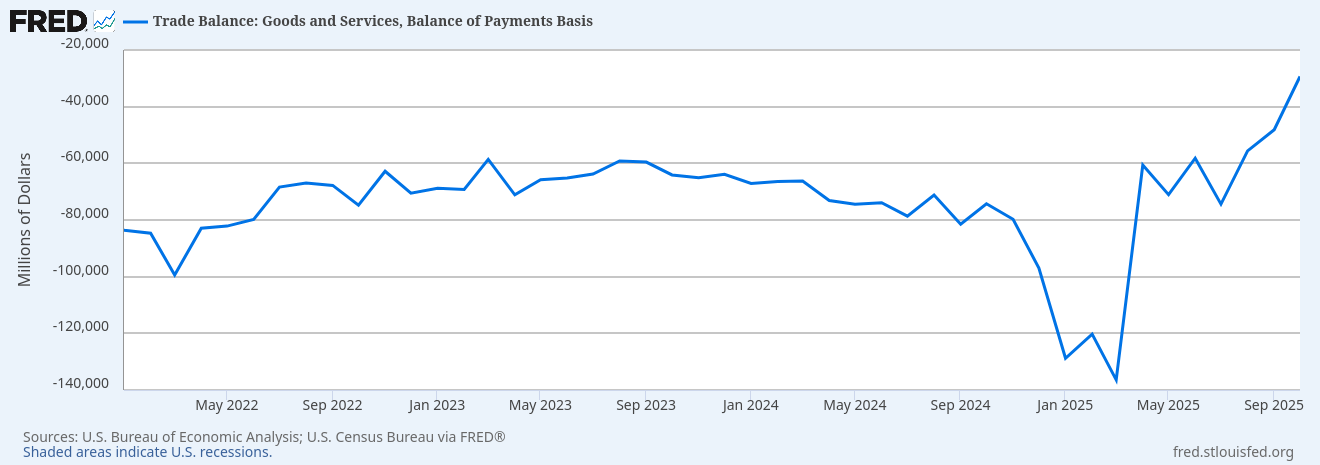
Which brings me to this graph, the balance of payments (trade deficit). If you eye-ball a line across the graph, between -60,000 and -80,000, you probably have close to the average trade deficit. Then you have “Liberation Day” in April and a huge spike. What’s that about? Those are businesses bringing in inventory prior to the tariffs taking effect. That inventory was spent down in the next few months, as businesses imported less because their inputs were sitting in warehouses. At some point they are going to have to bring in more product, and that’s why I think we’ll be back to roughly the same (maybe a hair smaller) trade deficit. We’ll have to see how it plays out, but the last reading was in line with the historical average.
That suggests that businesses are continuing to import final goods and inputs for their manufacturing at nearly the same rate as before the tariffs. Some businesses elected to eat the tariffs (note it is businesses that pay tariffs, not governments) rather than pass those costs onto consumers. They were assuming the tariffs would get rolled back and it’s better not to piss off your customers. They might even get refunds. But given the number of businesses that sold the refund rights to Lutnick’s kids at 20 cents on the dollar (yes the same one working for the president as the secretary of commerce), I don’t think they held out high hopes. We’ll have the lovely spectacle of the commerce secretary’s kids suing the federal government for refunds of illegal tariffs imposed by the administration, which they scooped up at bargain basement prices. Ain’t corruption grand?
If businesses are importing as much, and they are paying higher prices, and they have spent down their inventory, we might FINALLY start seeing the consumer level inflation impacts of tariffs. But we’ll first see it at the business level. Businesses have eaten the tariffs, for now, but will either suffer lower margin or start passing on those costs. That means businesses will start cutting costs to deal with tariffs and the easiest way to cut costs is to reduce head-count. When people no-work they no-spend. Block’s hope is the reduction in headcount (maybe over-hiring a few years ago), will result in better margins as costs fall, even if revenue falls. But, like I said earlier, there is no clear indication we’ve figured out how to incorporate AI into businesses or operate an AI provider profitably. It’s all subsidized by giant pools of investor money.
If you expect a softer economy (not radically expecting recession tomorrow), you want to hedge your risk (equity) exposure by buying bonds. Foreign companies have become a lot more wary of buying bonds, except there is no other currency with the depth of the dollar. And therefore US debt is still attractive. (TINA – there is no alternative right now). If short rates hold up because inflation actually starts making its way into the consumer market (not in one quick burst but trickling in as business after business has to raise prices), and the Federal Reserve can’t cut without resuming inflation, you should expect the economy to slow. By how much? I don’t know, but I would not expect long rates to stay where they are. I expect them to come down, or there is an increase that the Federal Reserve would need to step in by shoving liquidity into the system.
The two year has been betting the interest rates will stay about the same. Until February, the long rates were making similar bets (or maybe a little AI optimistic combined with nervousness about the Fed forced to cut rates combined with dollar de-risking). They were holding or going up slightly. Now they’re falling, compressing the yield curve. At the same time business costs may be going up. With a Fed that can’t immediately inject liquidity until the economy gets a lot worse. What a lovely little shit-show we’ve built.
This is not investing or investment advice to you, or anyone. It’s is provided for your entertainment purposes only. And if you are investing, contact a professional before making any decisions. Buying and selling stocks, futures, or any investment is a risky activity and can cause you to lose money, including the principal which you invest.
It may be the ONE TIME that the Fed slowed the economy but didn’t throw it into recession. The so-called soft-landing. Something I did not think could be done and therefore missed out on some returns (albeit at a higher risk). ↩︎
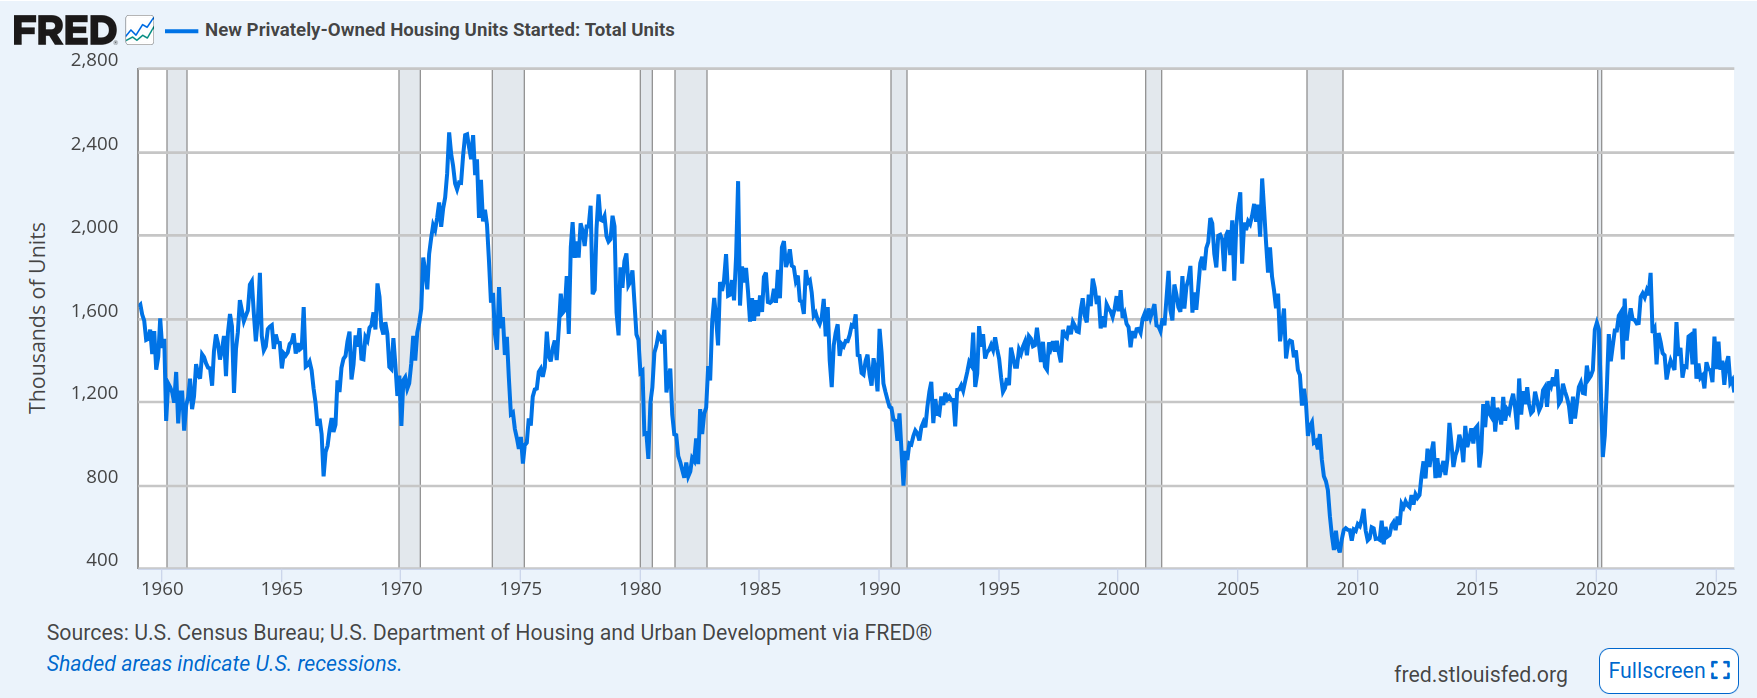
Housing starts I don’t think are as critical as they once were. It used to be that sales of houses were tied to a lot of other economic activity from buying new furniture to updates to existing homes. It used to be more a headline number and market mover.
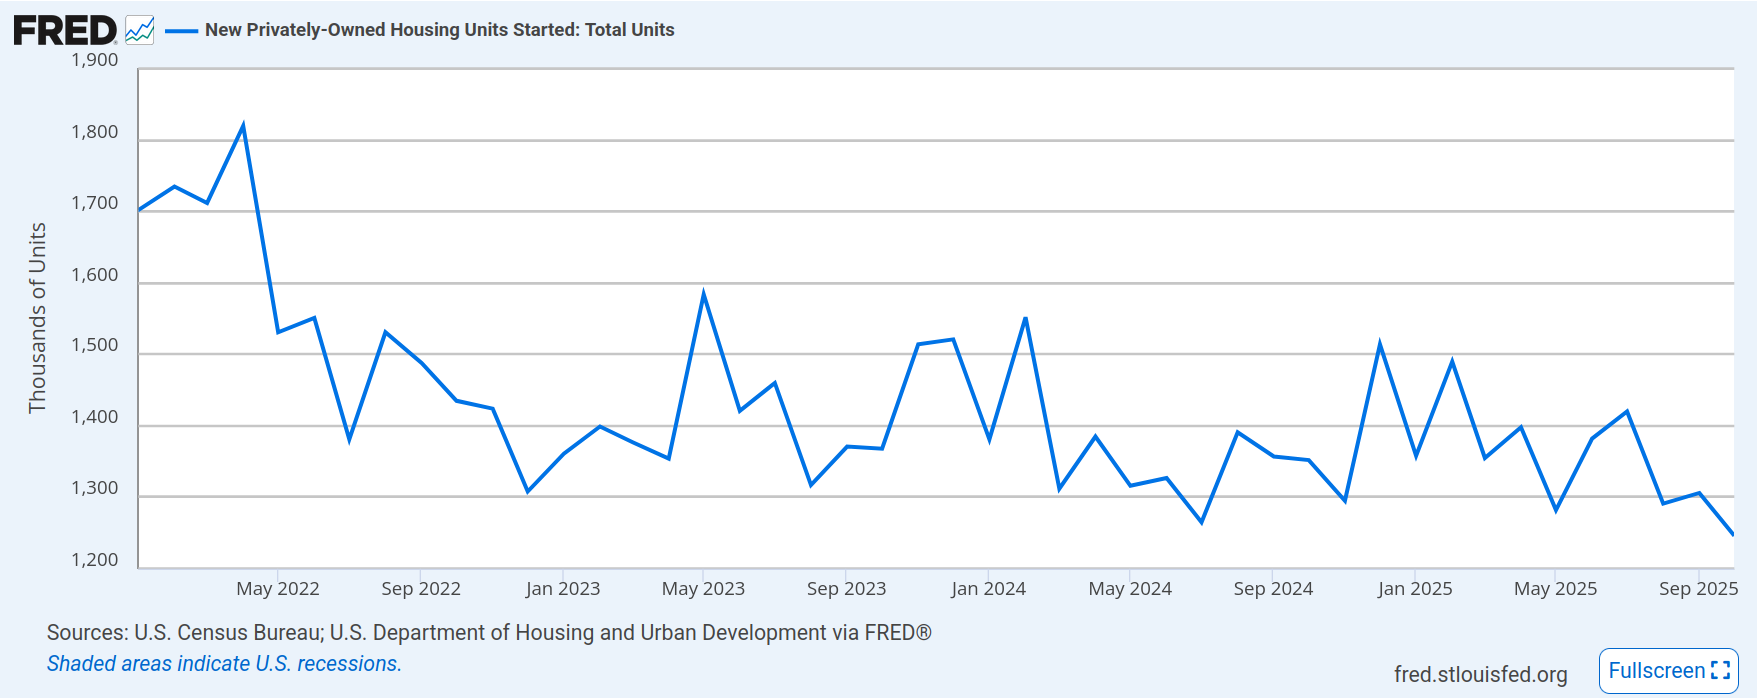
Here we see the last couple years of starts, compared to the historical numbers for housing starts. Although housing remains unaffordable for many, we don’t see a huge increase in starts over the last three years. From the chart above, we can see a jump shortly after the COVID lockdowns, but nowhere near enough of a bump to deal with the lack of housing created after 2008. And if you have to ultra-stretch your budget for a house, that doesn’t leave a lot for new furniture or trips to Home Depot.
The FOMC minutes, however, will be interesting to see. We’ll get a view of how hawkish or dovish the over-all committee is. And remember, even if Trump installs a rate-cut happy lunatic as Fed chair, that lunatic doesn’t set policy. It’s voted on by the full committee. Which is why Trump is testing his ability to fire other Fed members. In the presence of tax cuts and proposed spending increases, a Fed that cuts rates will be adding stimulus on top of stimulus when the employment rate is in the range of full employment. Which would attack the debt level by devaluing the dollars in which the debt had been issued. But then interest rates (should) climb, or the dollar (should) fall to offset the devaluation of the dollar. When the dollar falls, oil and other commodities climb in price, pushing more inflation. And there is no guarantee that the increase in wages would outpace inflation. We would almost certainly all be worse off.
A quick note for folks that think 0% unemployment is full employment, that’s not how it works. Inflation has a statistical relationship with unemployment known as the Philips curve. Below a certain level, like 7% unemployment, a decrease of 1 percentage point of employment has no impact on inflation. At lower levels of unemployment, a 1 percentage point decrease in unemployment drives higher inflation. Why? Because when the labor market gets tighter (and everyone is immediately swept up into a new job), companies wind up bidding up wages to attract workers.
Those workers have more money for cars, food, vacations, and so on, and that drives inflation from the demand side. Also, as wages get bid up, more workers come off the sidelines into the workforce. These range from moms who no longer see it economical to stay at home, or retired people seeing opportunities, or people who left the job market to write a cook-book, etc. You can get a month to month increase in unemployment as these people come back into the workforce, while having a very tight labor market. As we pushed down toward 3% unemployment post-COVID, that contributed to an increase in inflation. It was great because everyone’s salary was jumping, but few people feel it outpaced the impact from inflation.
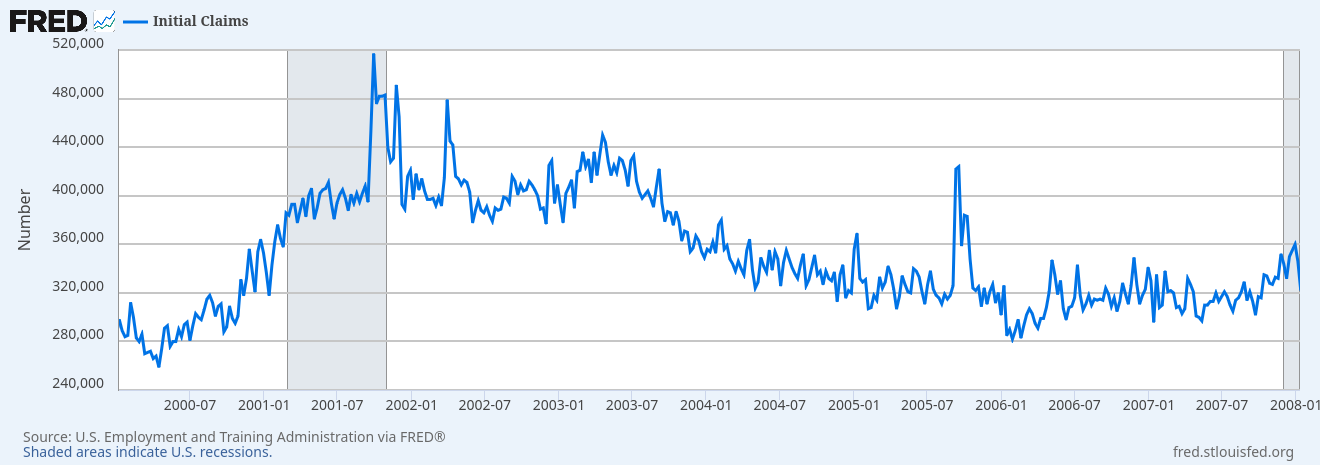
Here are the first time unemployment claims from 2000 to 2008. Although the first time claims rate accelerates before the 2001 recession, that doesn’t happen in every recession, with the first time claims generally being a trailing indicator. The lowest point on the chart, touched briefly at the peak of dotcom boomery, is about 260k.
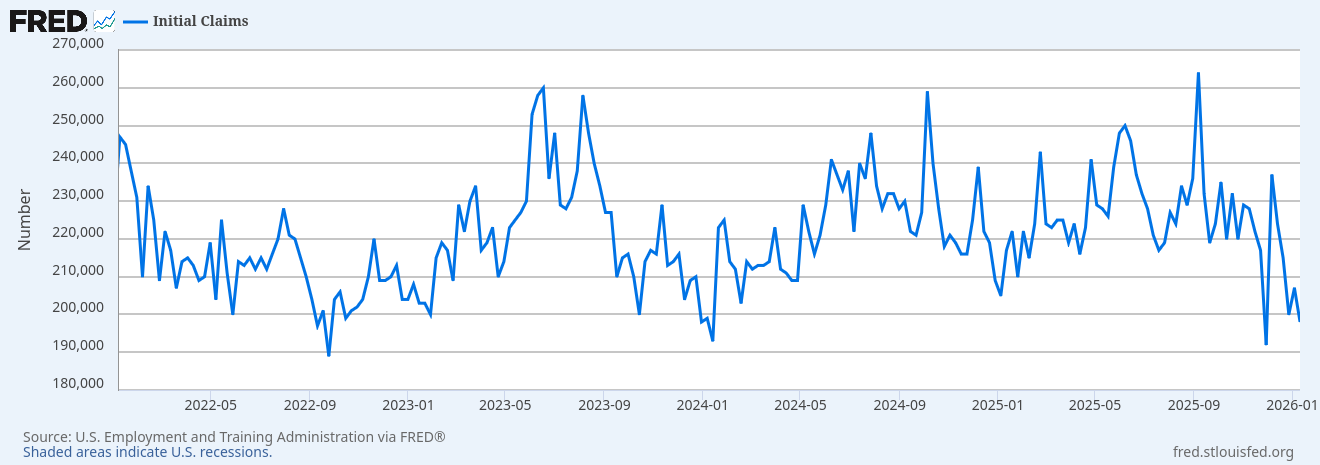
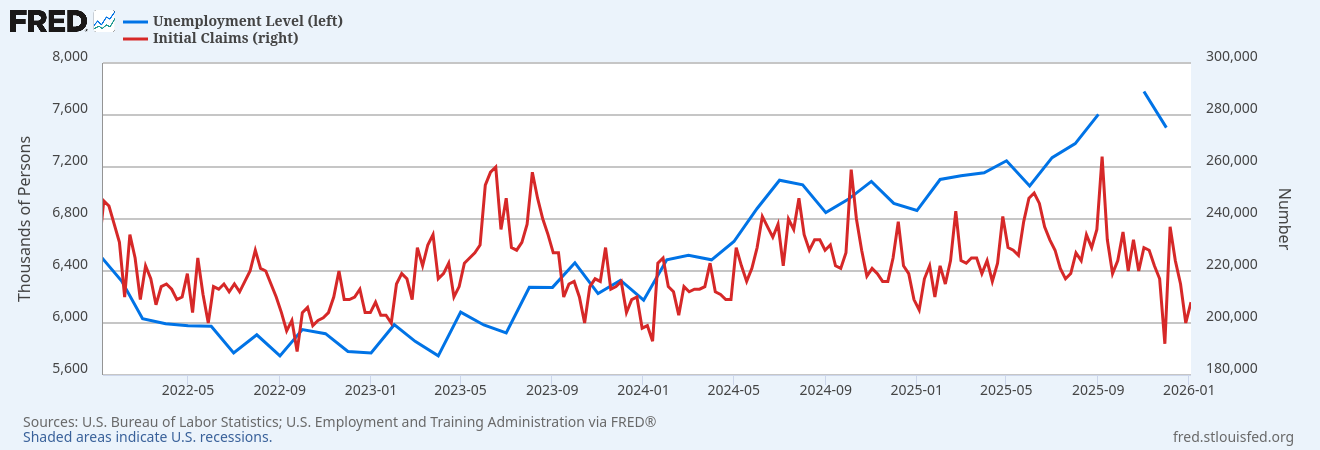
Here is the last couple of years of first time claims. Its highest point is about 260, which it touches during spikes. Although it looks more variable than the chart above, it’s not. It might be even slightly less variable. It’s low points are at 190,000. If I were to look at this, I would assume the jobs number would be substantially higher. We’ve created about 150,000 jobs over the last six months. To absorb new entrants into the labor market, that should have been 600,000. To grow, that should have been closer to 800,000.
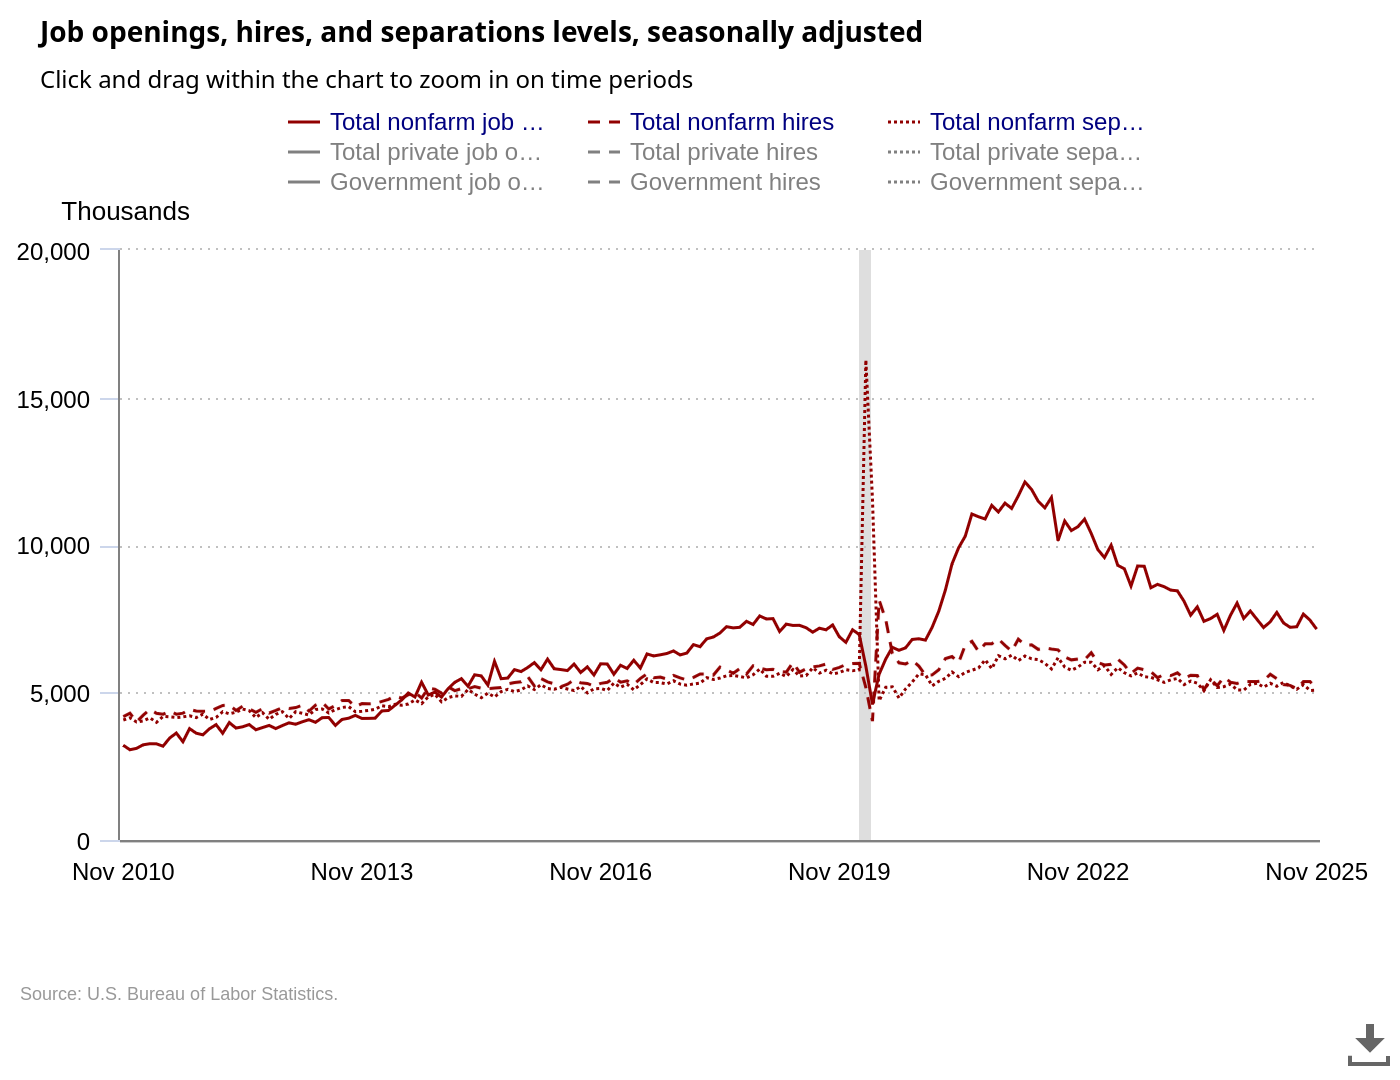
There is a degree to which we could be job hugging. No one is convinced they can hire a decent replacement. No one is convinced they can find a better job. People aren’t getting fired and they aren’t quitting. And there aren’t enough new jobs to absorb new entrants. What we should see in the JOLTS data are low separations, low hires, and low openings. But that’s not what we’re seeing. Which actually further confuses the situation.
Separations and hires are still historical norms. Openings are still high. This leads me to be even more convinced, every passing week, that we’re measuring the wrong thing. That’s dangerous because we can be optimizing the wrong numbers. Maybe the Fed is too worried about the job market. Maybe it’s doing better than anticipated. I’m more convinced the job market is structurally different than it was even 10 years ago. That means comparing even 2006 numbers with 2026 numbers could be misleading. Is the gig economy, ranging from Uber to Only Fans the new “go to” when you get fired? Should we be measuring the number of gig workers? The BLS understands the need. But the current statistics are too spotty and hard to compare (also because of the lack of history).
If this seems like splitting a hair, let’s take a look at some policy choices. The first is to leave short term rates where they are. This is likely having a depressing impact on the labor market. If we depress the labor market too much, we go into recession. (Although our latest Keynesian experiment may offset that). If we cut rates slowly, we relieve pressure on the labor market, but does that cause more competition for labor to the point where we get inflation? Or does it ease the pressure to relieve the risk of recession? Finally, there is aggressively cutting rates, which what the economics illiterate Cheeto wants. That could drive a freight train of inflation through the economy and tank the dollar. But from the labor market data, it’s hard to say which is right.
All the options seem logical. If you look at the monthly jobs number, it looks like recession is right around the corner. If you look at people losing their jobs and filing unemployment, we have a perfectly fine labor market. If you look at the JOLTS data, the labor market is dangerously tight, with many more openings than workers. Or is the JOLTS data signalling weakness as we drop below the 5,000 level? I’m more partial to the jobs number and its erratic cousin, the ADP report.
The dollar is the most often used thing of value in which non-USA countries store their foreign currency reserve. First off, what’s a foreign currency reserve? These are often large sums of currency held by the central banks of various countries to stabilize their currencies. If there’s a sudden shock on the Swiss Franc, the government of Switzerland can buy or sell dollars to mitigate the shock. In some cases, the governments also use reserves to facilitate trade or government purchases. This was traditionally done with gold and silver. However, since 1974, it has largely been done with dollars. Dollars provided by a country that (until recently) was committed to international rules and institutions that facilitated trade and rule of law for disputes.
The dollar is not only a reserve, held by many countries including China and Russia, but also a preferred currency for many international exchanges. When you buy a barrel of oil, that contract is denominated in dollars. (Even though the Saudis did poke Joe Biden in the eye by executing some contracts with China in Yuan – it was a political move, not based economics). If a large bank, or a government, lends money to another country, it will generally do so in dollars. A German bank does not want useless Bolivars, Dinars, Pesos, Drachmas, or Rials. They want dollars, Euros, and Swiss Francs (probably in that order). The country or government receiving the loan also wants dollars. (Although Euros can be fine, as they translate quickly and easily into dollars).
This puts the United States in a unique position, as the world’s supplier of dollars. When we run a deficit, we borrow that money in dollars. If a German bank buys a US treasury bond (a loan to the United States government), it will be repaid in dollars. The repayment risk to the German bank is minimal, as the US can just print all the dollars it wants. The risk to the German bank is the US will be poorly managed, and the value of the dollar will be inflated away. Let’s say the German bank buys the treasury bond for $1,000, expecting to receive $50 in interest every year for the next five years and then the $1,000 principle. At a 2% inflation rate, that $1,000 will be worth about $900 in today’s money. But if the US engages in some very stupid decisions, and the inflation rate climes to 5%, that will be worth $775 in today’s money. Until recently, the US has had largely very sober, responsible economic managers, so the risk was minimal.
How bad can inflation get? We’ve had 5% inflation for short periods at numerous times. It didn’t really bother people that much, because it quickly fell back down. We had around 9% under Biden for a brief period and people lost their minds. But many places have seen inflation rates in the 20% or more range for prolonged periods of time. They still survived as countries. Even hyper-inflated countries have held together. At a 20% inflation rate, the German bank would see $325 returned in today’s money. If that bank had any real fear the US was going to 20% inflation, they’d avoid the bond until it had over a 20% interest rate. But most US debt is actually held by US individuals.
On net, this is a good position. If we want to buy something we make the magic tokens most people want to exchange. If we need more dollars, we can make more. We don’t even have to print them. We just put some numbers in a database. People are also willing to buy our debt, which we will pay back in those same magic tokens we make. Unless we do something stupid, that results in protracted, high inflation, we will continue to hold this unique position. The contenders for this rare status are the Euro and the Yen. No one wants Yuan or other BRICs currencies, not even the BRICS countries. Many countries hold a basket of currencies that include Yen, Euros, Swiss Francs, gold, and silver, but the US dollar is the workhorse currency.
There have been a couple of recent incidents, however, that may interfere with the dollar status. The first is seizing reserves. Specifically, a federal court seizing Argentine dollar reserves held in the US to pay creditors. For any country relying on the auspices of the Federal Reserve to hold their reserves (which many countries do), the chance they are seized by a US court has to be taken into consideration. (The US also holds the gold reserves of other countries as well). Unless you want to have palettes of $100 bills in a warehouse, you may want to hold bearer bonds, gold, and silver in your own country. Along with this was partially pushing Russia out of the financial system for the invasion of Ukraine. Although this was something I felt was necessary at the time, with the recent administration, European countries especially might be concerned. Could UK assets be seized if the UK does something that insults the orange idiot? Before now it was assumed that it would require a lot of legal mumbo-jumbo – but with the administration operating outside the law, it becomes a matter of fiat by the generalismo.
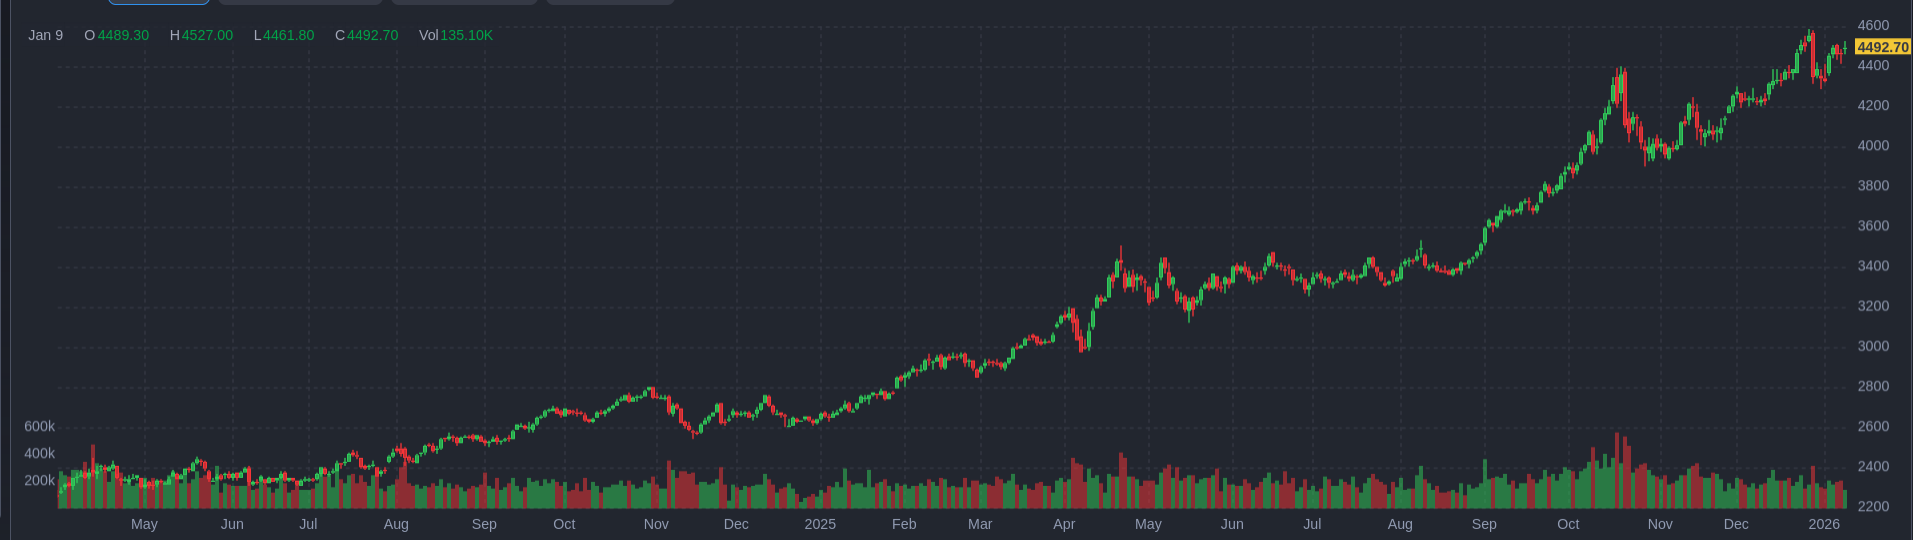
What would the world do? I really don’t know. The idea of crypto currencies stepping into this role is ridiculous. The volatility of any crypto makes holding it as a reserve nearly suicidal. Likewise, gold seems unable to handle the requirements of a much larger trading system than pre-1974 trade. It would also be a boon to the Russians, something many Europeans would rather avoid. However, as we’ve seen, gold has been been climbing steadily over the last year. And it’s hard to detach the timing from the chaotic nature of US policy. The Euro and the Yen are not there yet in peoples’ minds. The Yen may be closer to that role than the Euro, which seems too susceptible to political meddling from Europe. (Which should be a warning to the dollar).
What would happen to the US if the dollar no longer occupied its current position? I think it matters how we get there. If we get there because of an orderly move to more balanced baskets of reserves, not much. But, if we get there because of dollar weaponization or severe inflation, that’s a different story. For one thing, we would be paying higher interest rates on US debt. If it’s an inflation story, both US and foreign bond holders would want higher interest payments. Somewhat less if it’s a weaponization story, but they still would want compensation for added risk. The dollar would fall in value as people demand less dollars. As a country that imports quite a bit of stuff, this would push inflation.
But I suspect the biggest change would be the world no longer has to “grin and bear it,” when the US does something they don’t like. On one side is a fall into policies that degrade the value of holding dollars On the other side is a fall into the world of inflation. Maybe it isn’t a tight rope. Maybe it’s more like a balance beam, with more room for error than I believe. But at the end of the day, the loss of the dollar’s special position would not make America great again.
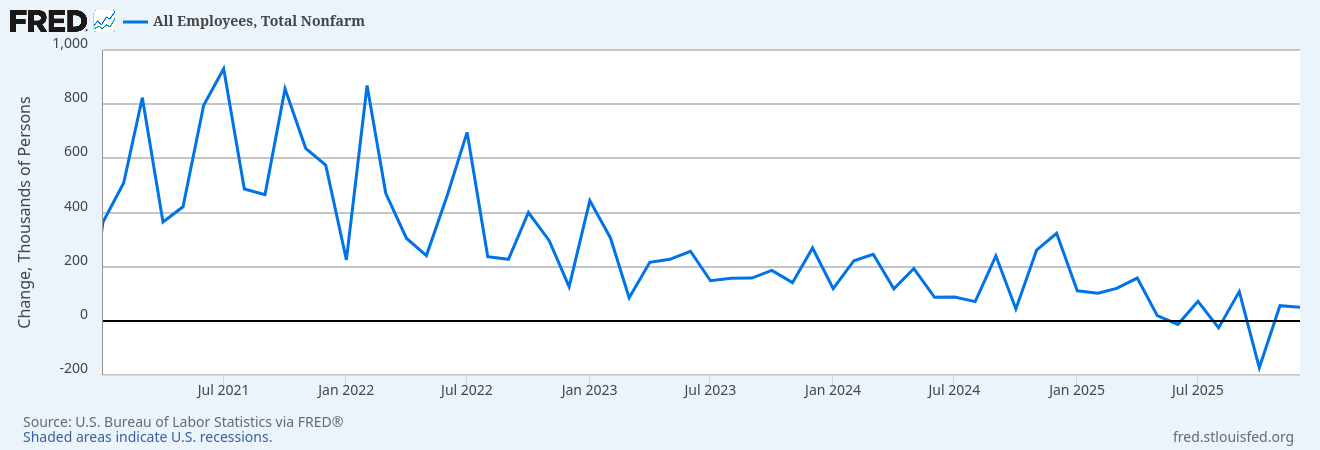
We have 3 numbers in fairly short order: JOLTS, first time claims, and the monthly jobs number. What do we have so far? The first time claims continue to come in well below ‘recession’ levels. From that number, the labor market looks tight. The JOLTS data, covered earlier, indicates a functioning labor market and not a great disconnect between people leaving jobs and people getting hired. And today we have the non-farm payrolls number. Let’s also add in the ADP number (which I do not think is as reliable as the payroll data). Both the payroll and the ADP number show a struggling labor market, according to historical metrics. Not a bad labor market, but a struggling labor market. Like most economic statistics, we care more about trends than the absolute number, but a non-farm payroll number indicative of a very healthy labor market would be above 150,000. Although it’s possible to get the occasional blip below 100,000.
Note the left hand side is the crazy period when the job market went nuts after COVID.
So far we’ve had about 160,000 jobs created over the last six months. That’s well below the number we need to absorb new entrants into the economy. The less reliable ADP number confirms the payroll data. The JOLTS data indicates a reasonable labor market and the first time climes show little job loss. This is where I think the first time claims may be under-reporting. If you lose your job, you might make slightly more money driving an Uber than collecting unemployment. I suspect other factors are depressing the actual number of people who would seek unemployment assistance. That’s not necessarily a bad thing, if you can make more money driving an Uber than collecting unemployment. You would be better off, even if you are grossly under-employed.
The red line represents initial unemployment claims, while the blue line is a survey of people looking for full time work.
This is why there is no magic single number, and no magic single sample of that number, that gives you a picture of the US economy. From the numbers, the labor market looks slack but not recessionary. It seems to back up the anecdotes of job hugging (where employers and employees may want to part ways but decide it’s better not to part ways right now), and new entrants having a difficult time finding a job. If it’s true that 70 million Americans engage in some kind of “gig” work, that’s nearly half the labor force (about 160 million participants). And maybe a weak jobs number isn’t as bad as it sounds if people can enter the gig economy instead of a “regular” job, and those people are under-counted. (Setting aside issues of job security, benefits, and the impact of under-employment). Is the labor market indicating recession?
There is something we need to acknowledge. Deficit spending is stimulative. At the end of the 2008 recession, there was a push-back on yet another democrat taxing and spending. And the stimulative policies were tempered by the resistance from republicans. (Although at levels that now seem quaint). That drew out the recovery period because fiscal policy was not injected into the problem. Spending more money than the amount removed through taxation stimulates activity and we may have ratcheted that up with the latest budget. We won’t know the final numbers until 2027. It will depend on actual receipts and actual outlays. There is some evidence the outlays will be higher than anticipated, with the DOGE effort showing an actual increase in government spending. If income tax receipts are weaker than offsets from tariffs, it could easily come in above estimates.
The current CBO estimates put the 2026 estimated deficit at 5.5% of GDP. The percentage of GDP is useful because it allows us to gauge what the real impact of the deficit, given the size of the economy. After all, a billion dollar deficit is a much bigger issue if the economy is only 10 billion dollars in size. The 2026 number may be above (likely) or below (unlikely) estimates given factors we won’t know until later. We won’t know until we actually see the impact of the new tax law, along with actual real spending.
The deficit coming down slows the economy in kind of a natural way, as activity boosts tax revenues and broader employment lowers spending on programs like SNAP and unemployment insurance. This natural brake pulls money out of the economy in higher tax revenues and lower spending, reducing the risk of the expansion becoming inflationary. However, we are doing two things that are expansionary for 2026, which are reducing tax rates and pushing the Fed to lower rates. In the face of already expansionary fiscal policy, this may push inflation for 2026. Unfortunately, it’s almost impossible to know the actual impact on inflation because we don’t know how the economy will react. The consumer in the lower 50% of income is in shambles. Most of the consumption is done by the top 20%, with half concentrated in the top 10%. There may not be the purchasing power for broad inflation, even if high end goods may see a level of inflation.
In addition, lower imports from tariffs boosts GDP, even if it means people are consuming less stuff. Could we be in a world where stagnation is masked as the GDP “increases” due to fewer imports? It’s mathematically possible. You could have patchy inflation depending on what goods you are measuring along with an improving GDP due to fewer imports. (You aren’t better off, you just don’t buy that sweater or bottle of wine, because it’s a little pricey). Combine this with jobs numbers being a less reliable measure of economic health (because workers don’t leverage unemployment insurance and transition to gig work), and you could have a stagnant economy, even if the numbers don’t look bad. You have low unemployment because of gig work and GDP growth from lower imports, even though you are under employed and just can’t afford things you used to buy.
Note that numbers are negative, so sloping up and right means the lower imports.
At the end of the day, the purpose of economics is to understand how these voluntary and sometimes emergent systems of interaction between people create well-being. The purpose of 2% inflation or a target of 4.5% unemployment isn’t because the number is important, but because the well-being of many people seems to change at around those inflection points. If inflation drops below 2%, that is usually because economic activity is slowing and over time we will be worse off. If it goes above 2%, that’s a level people feel it erodes their buying power and they are less well off. If unemployment is too low, there is inflation as wages are bid up, while if it is too high, people are out of work and can’t find jobs. The goal of the specific metric should be to indicate when a change in policy is necessary because people feel their well-being is falling.
But it feels like we’re too focused on the numbers, rather than what they mean. I can’t count how many times it feels like the number itself is the target or the policy is being gamed to meet the target number. This includes “patching up” numbers like the CPI so they under report inflation. (There is mixed evidence on this. But we would expect the CPI goods basket to change as the basket of goods and services from 1976 is less applicable in 2026). When the economy changes, the old metrics used to gauge the health of the economy no longer make sense. Following unemployment claims or number of jobs created, if people are shifting to gig work that isn’t reported through these numbers, may no longer provide a meaningful metric. And yet, we don’t have a widely accepted substitute. Like a quantum system isn’t in one state or another until it’s observed, our economy is both good and bad at the same time, because we lack the metrics to observe it.
As Q3 GDP arrives, it’s above expectations. I hate anecdotal accounts as a basis for inferring trends, but we have had report after report of worsening conditions for individuals. Whether it’s visits to food banks or layoffs, or retailers pointing to weaker consumers, it feels like Q3 GDP should not have come in at 4.3%. I’m certainly not saying anything ridiculous, like the number is a fabrication or it should have been something negative. I live in the real world (or at lest do my best to discern the real world around me). Somewhere in the 3.5 to 2.5% range felt reasonable.
I’m still digging through the explanations, but one thing that sticks in the back of my mind is feeling like a 4 year economics degree was a joke. All the discussions about stability, or rule of law, or predictability as good soil for economic growth, are out the window. Apparently, you can run the economy like a drunken loon and it doesn’t matter. Or the government stepping in to buy stakes in companies is now a good thing (remember when the evil government stepped in to buy a stake in the big three)? Nosebleed deficits are now okay. Absolutely bonkers ideas from those responsible for our economy, like replacing income taxes with tariffs, is now calmly, if not happily, digested by the markets.
But the biggest shock is the degree to which tariffs don’t matter. It’s part of a larger narrative, where the lower income folks that make the stuff get the shaft and higher income investors and managers are doing better and better. (The managers and shareholders do well as profits, bonuses, and stock awards roll in for moving production overseas, while local workers lose their jobs. While the remuneration is tax efficient, at lower rates for capital gains, the unemployed eventually see their benefits cut because they’re ‘lazy’). We make life better and easier for the top earners while fucking the bottom quartilehalf three-quarters. Any discussion of taking the surplus from trade and using it to offset the negative impact as jobs shift overseas or are eliminated entirely is sidelined as socialism.
But I digress. We have had chaotic, possibly illegal, and arbitrary tariffs and restraints of trade (like who the fuck thought the government should get a ‘cut’ of GPU sales). And it doesn’t matter. Push for inflationary rate cuts. It doesn’t matter. Heck, I could be wrong, we might not get inflation. Make enforcement a function of bribes to a would-be monarch. No problem, apparently rule of law was not important as long as a bribe gets you what you want. Need to merge? Don’t look for clear guidance to support M&A, just give the grifter in chief and his cronies their vig. Policy clarity can be defined as knowing where and who to bribe.
Am I angry that GDP came in at 4.3%? It surprised me, but I’m not angry. I am frustrated that all the talk about the care and feeding of the economy, the hard choices we need to make to keep it running well, or the degree to which we need the best people running seems like a joke. All the ivy league, PhD, novella-sized CV people apparently were just tooting their own class horns. You took an economics at a community college and think we should return to the gold standard? Who the fuck knows at this point, maybe it will work. You’re a welder who thinks we should stop importing things from Turkey to boost GDP? Sure, why not. Think there’s a trillion dollars of spending that can seriously be cut? Sure, no problem, fuck the math.
Admittedly, this was a rant. Maybe we’re floating on a bubble that may pop badly. And then we might see the effects of stupid policies through the lens of a spiraling economy. And we’ll rediscover we need intelligent, skill people in charge. Or maybe not. Maybe Baumol and Blinder is as much a work of careful fiction as a theology textbook.
But that’s not something I want for me, my family, or my neighbors. Maybe we’ll see the government wade further into business by back-stopping any collapse with “free money” of cheap interest rates, loan guarantees, and buying even more equity in private companies. I remember when that kind of socialism was something Republicans vehemently opposed. Against all the good principles of being careful stewards of the pillars that hold up prosperity. Manipulating rates, funny money deficits, state owned companies, and corrupt officials were something we pointed to as markers of guaranteed economic suffering under tin-pot dictators. I never could have imagined it would be our future.
If you don’t think something is very wrong, you’re not looking very hard. Recently, the cost of the average new car in the US topped $50,000. The median household income in the US (meaning the half way point, if you arrange all peoples’ incomes from lowest to highest) was about $83,000. The mean was about $66,000, suggesting a lot of skew from a bunch of very high incomes at the top end of the data set. So the “average,” under some definition of average, American household would pay about 70% to 80% of their income for the average new car.
If we go back 30 years, to the mid 1980s, median income was about 24,000 in 1985. (Not adjusted for inflation). If you adjust it for inflation, we have to face the ugly fact that 40 years has only taken us from $64,000 of 1985 median household income in today’s dollars to $83,000. Meaning that with all the advancements we’ve seen, and all the gains in productivity, our earning power grew just 35% or so. That’s less than a 1% improvement per year. But in the 1980s, a nice Buick or Dodge set you back less than $10,000. You could get economy cars for $5,000 – $7,500 price range. The average new car set a family back less than 50% of its income. Less than a third, if the bought an economy car. Even if you adjust for inflation, the average new car should be in the $25,000 to $30,000 range. To get to that that “less than 50%” range in today’s actual prices., you need an income of at least $100,000, if not slightly more.
This is the difference between purchasing power, wealth, and income. Partly it’s inflation, and partly it’s not inflation (to the degree inflation measurements aren’t arbitrary). The price of an “average” new car has risen faster than inflation. So has housing. So has medical care. So has education. If you could easily afford an average car in 1985, but struggle to buy an average car in 2025, you are poorer as far as cars are concerned. If you could afford to go to the doctor’s office in 1985 but not 2025, you are poorer along that axis. However, an IBM PC computer or original Macintosh cost maybe 10% of your 1985 median household income. Today, that (relatively) high-end computer is in the 3-4% category. We’re much richer on that axis. The necessary stuff is more expensive, but escapism is cheap.
I would argue that the things that matter, like food, housing, and transportation are why we feel poorer today. Setting aside the paltry growth in inflation adjusted median household income (while upper incomes have grown much faster than inflation), having to put yourself in deep debt to do “normal” things hurts.
The fact we are drowning in televisions, computers, and other gadgets doesn’t compensate for not being able to afford college. If I were to ask most people struggling to buy a house, would you rather have: more expensive TVs and computers or cheaper houses? They would opt for the house. If I asked the person trying to get one more year out of the ride that gets them to their job, if they wanted cheaper cell phones or cheaper cars, they’d opt for cheaper cars. Or a public transportation system that didn’t feel punitive in its cost and inefficiency.
You need transportation, you need a house, you need to go to the doctor and the dentist. Those seem more and more like luxury items. That’s what feels so wrong about today. I caught a passing notice about Paul Krugman saying China has passed the US in purchasing power parity. They may have. I haven’t read it. I’m a little tired of Krugman, who lost credibility with me as an economist, for focusing on too many nakedly partisan issues. But we all feel it. If you make more money next year, it doesn’t really feel like you got ahead. In fact, it feels like you’re falling further and further behind.
So you tell me, after 40 years of progress, with companies worth trillions of dollars, and with two people in a race to be the first trillionaire, does it feel like we’ve advanced? Do you feel wealthier? Does that seem like a system that’s working for the benefit of most people? Do numbers like GDP and a soaring stock market paint a rosy picture, so we we learn to ignore what our lying eyes are trying to tell us?