This is not investment or investing advice. It is for entertainment purposes only. Contact your investment or tax professional before making any investment decisions.
A couple of days ago I took a look at Nvidia, to kind of show how I look at where the stock is headed. I actually prefer to buy ETFs or funds than stocks, but I do buy some individual stocks. And some of what I say is also applicable to those funds and ETFs. Although you have to look at them individual and figure out if the ETF or fund matches your objectives. I learned this early on when I bought into some funds to see the sector outperform the fund, only to realize the weighting the fund used wasn’t what I expected.
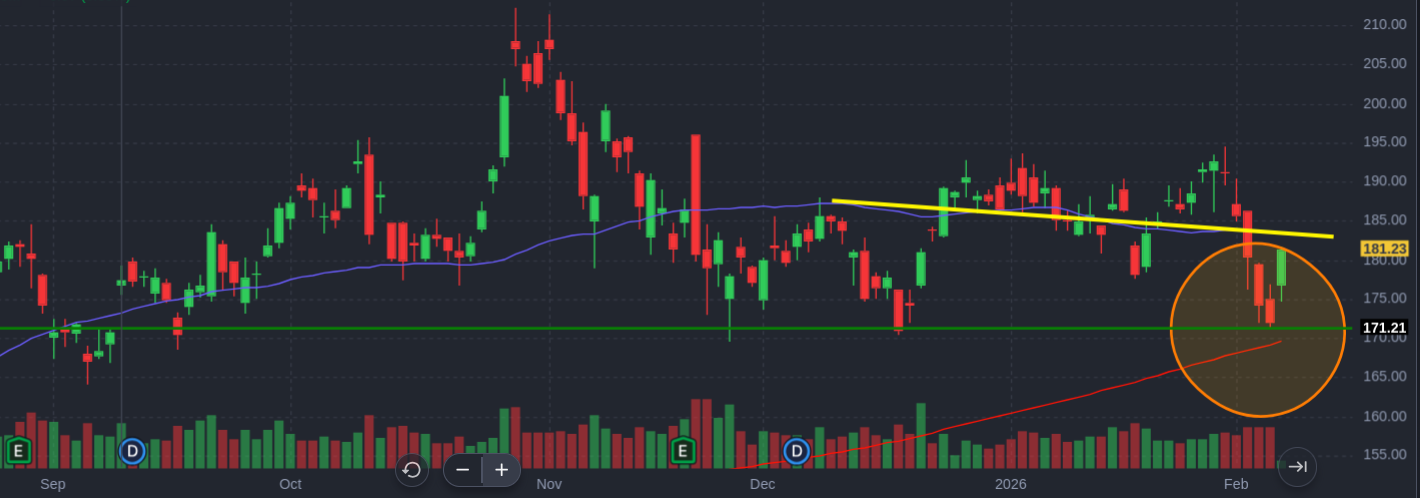
I use the term support line, but I think of it as more of an area. It’s not that buyers come into the market at 170.95 and lift the price. It’s more that when the stock gets to that price, various people are stepping in to buy. And I use the term people here very loosely. It is a combination of ETFs and funds, along with large institutional investors. It used to be that lunch time on say, Wednesday, you could actually put in a trade that would move a sock price. But I don’t think that’s true any more, mostly because trading volumes are much larger.
Anyway, once prices hit a certain zone, buyers seem to step in and keep the price from falling. It may only be a pause on its way to lower levels. Most support lines are found buy simply eye-balling where a series of lows caused the price action to reverse. It may have dropped below that level for a bit, but quickly comes back up. When the price action drops to the support and comes back up that’s called “testing” a support and the more that happens, the more significant the support area becomes. I picked 171 because I see the price approaching that area multiple times and bouncing back. I don’t think exact numbers are particularly useful.
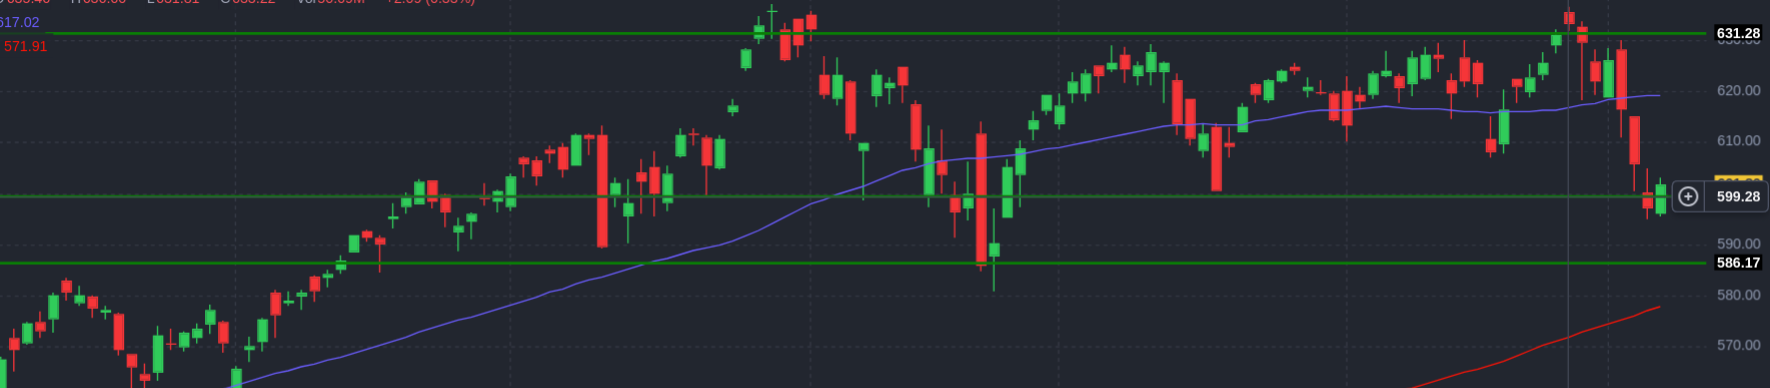
But the whole market is taking a breather in the morning pre-market session. Nvidia (NVDA) is part of the NASDAQ composite index. (Don’t ask me what NASDAQ stands for). It is a significant part of the index, so it’s behavior will impact the broader index behavior. To me there’s a support area extending from about 600 to 585. (This is the QQQ, which is the cash index for the NASDAQ 100). I view the support areas to be less precise on the cash index because it is the byproduct of a lot of buying and selling, both through the index and its individual components. The line on top is not a support line, it’s a resistance line that suggests most market participants decide anything above 630 drives selling.
The chart of the cash index is different from what most people look at when they look at the NASDAQ, they look at the futures market, as shown below. It is not the product of buying and selling stocks. It is the the prices of the futures market for the index. A different thing is being traded. In the futures market, we see a gap that doesn’t exist on the cash index, and the prices look almost, but not quite, the same.
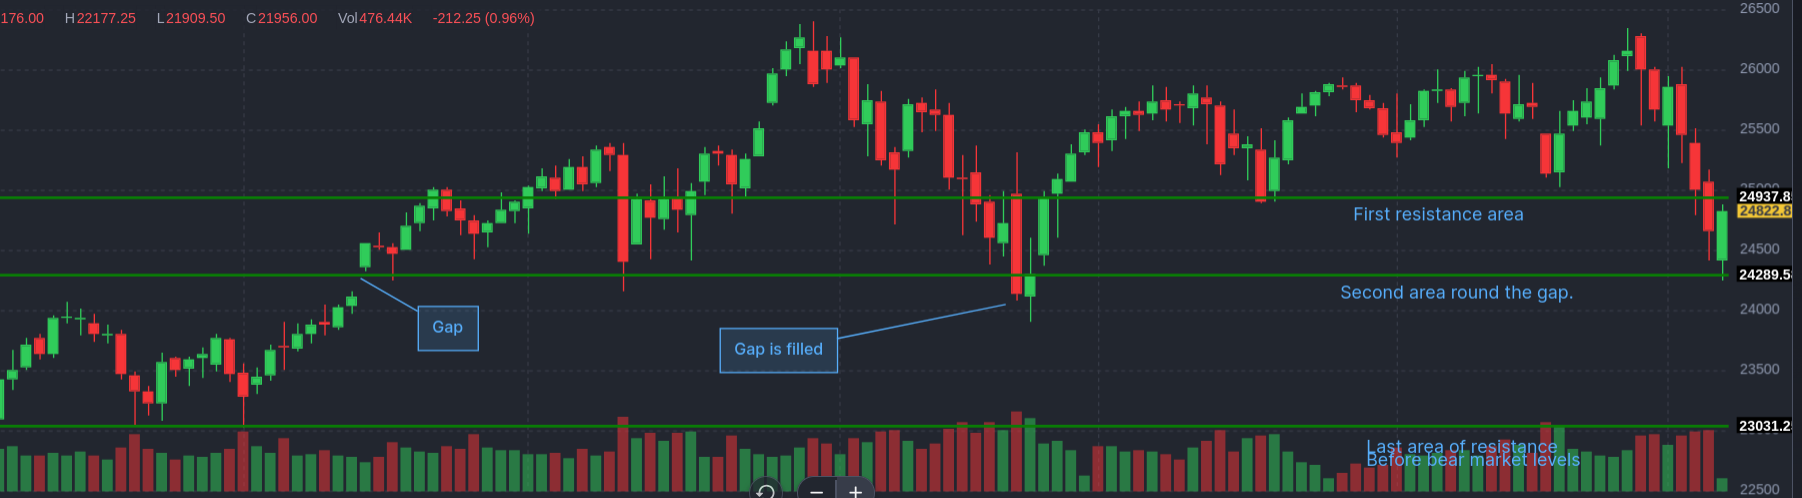
On the chart of the NASDAQ futures, I see a similar support area but I think they’re actually two support lines. There’s one at 24,937 (remember – not exact) and one at 24,289 (not exact). Remember, I eye-balled the lines and read the price from there. I didn’t pick the price and draw the line. We ploughed right through the first line (which probably means it wasn’t really an area of support). And today, the pre-market is bouncing off the second line, meaning it’s holding. That second line is formed on the basis of it being the bottom of the gap (which was eventually filled). But again, it’s more that zone around 24,289 where a mix of funds, algorithms, and large institutions will see a buying opportunity.
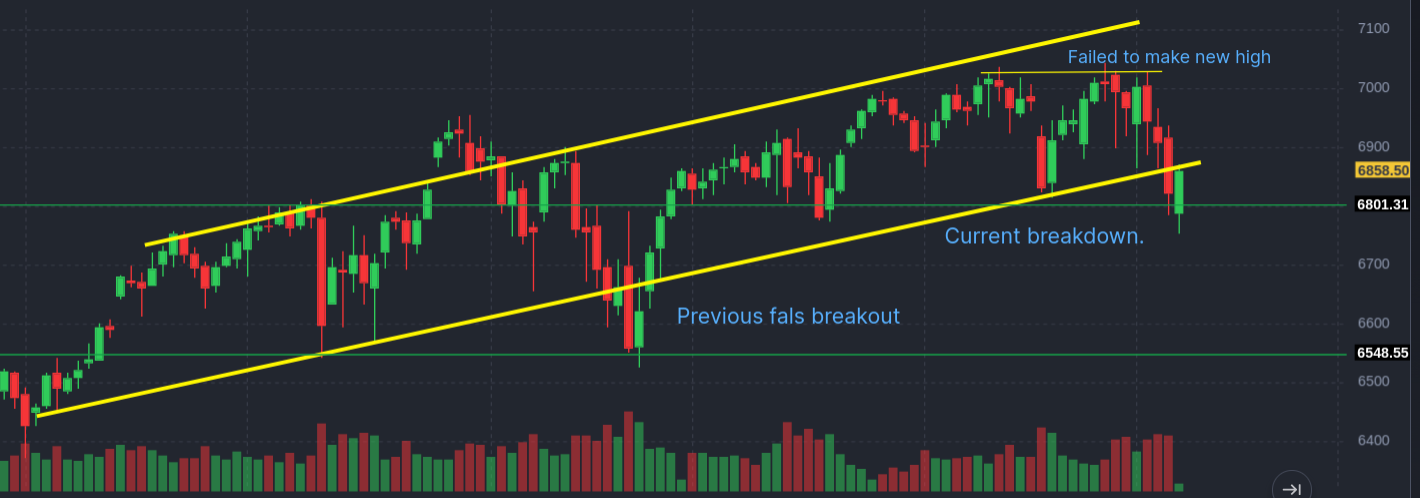
Looking at the S&P 500 Futures I’ve identified what I think is a trend channel. We see a failure to make a higher high at the end of the channel, and a break down from the channel (which we won’t know is significant until we’ve had more than a couple of days trading lower). And we briefly pushed into what I think is a support area. The support area holding means going lower will be a challenge, but the other factors are bearish. (Meaning there’s more interest in selling). But this is just to show the broader market is pausing at some level of support.
To be honest, I have no earthly idea what makes a large fund decide the prices to buy or sell NVDA or the other components of the NASDAQ, a NASDAQ future, or any stock. Maybe they just think we’ve come too far these last couple of days and they’re buying the dip. Maybe it’s just selling or buying to offset options contracts. I really don’t know. And no one knows, except for one thing that investors made clear with Google yesterday and AWS today. They are no longer looking at hundreds of billions of AI investment as paving roads for future growth. They’re looking at it as burning money that may not come back. And because many investors (both small and institutional) use baskets of stocks (like ETFs), stocks are now more likely to move similarly than before.
To wrap this up, I wrote this to clarify my thinking on what’s going on with the market. To remind myself, that even though I drew a line, It should have been a fuzzy, broad line, not a precise, skinny one at a specific number. I also like to see what the giant ball of money is doing today. It’s sloshing away from defensive investments, like consumer staples, and back to risk and tech, now that we had a big move away. That money sloshes back and forth, back and forth, each time allowing the smart money to bleed more and more off retail investors.
And this is not investing or investment advice to you, or anyone. It’s is provided for your entertainment purposes only. And if you are investing, contact a professional before making any decisions. Buying and selling stocks, futures, or any investment is a risky activity and can cause you to lose money, including the principal which you invest.
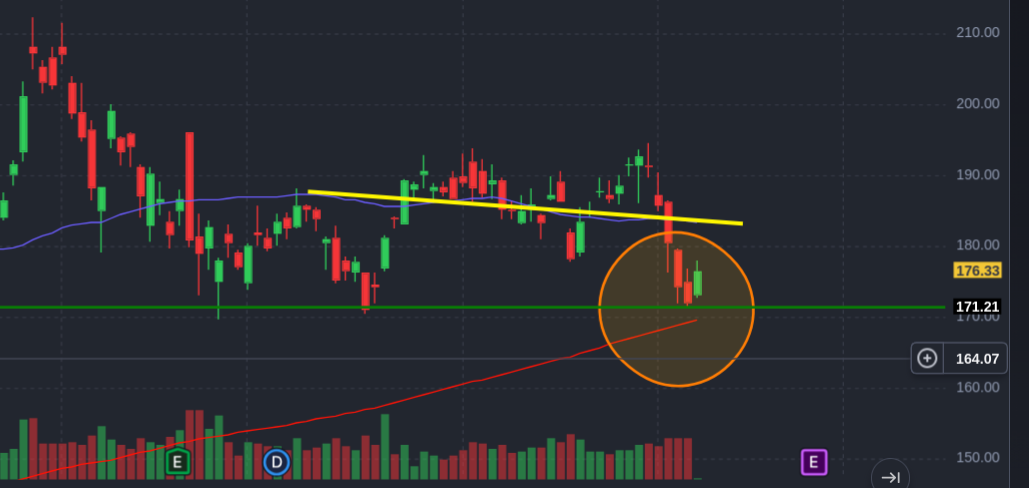
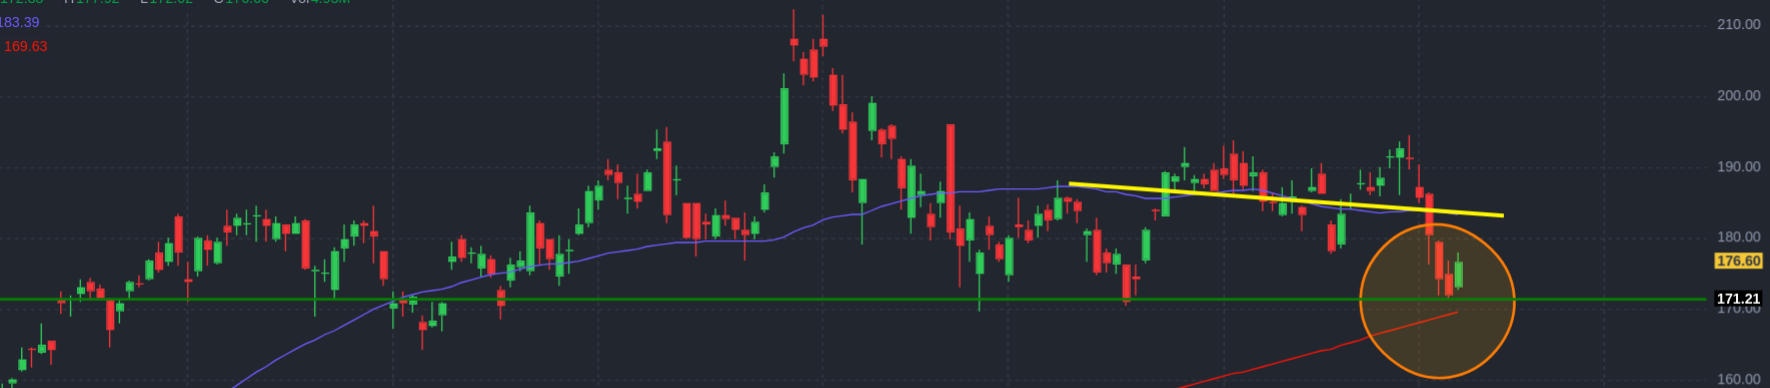
[Update] The screen shots above are from the pre-market session. The regular session can look a little different, for example, here’s NVDA, note the slightly different representation of today’s candlestick. Which is also a reminder that what you see may be determined by the conditions under which the prices were collected.