What Are You Looking At?

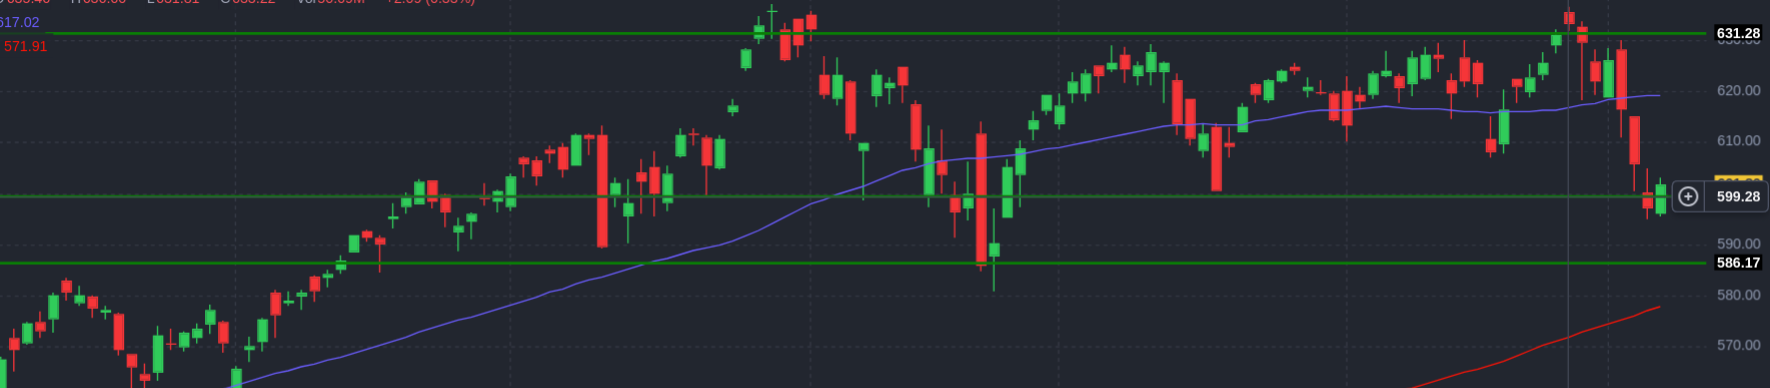
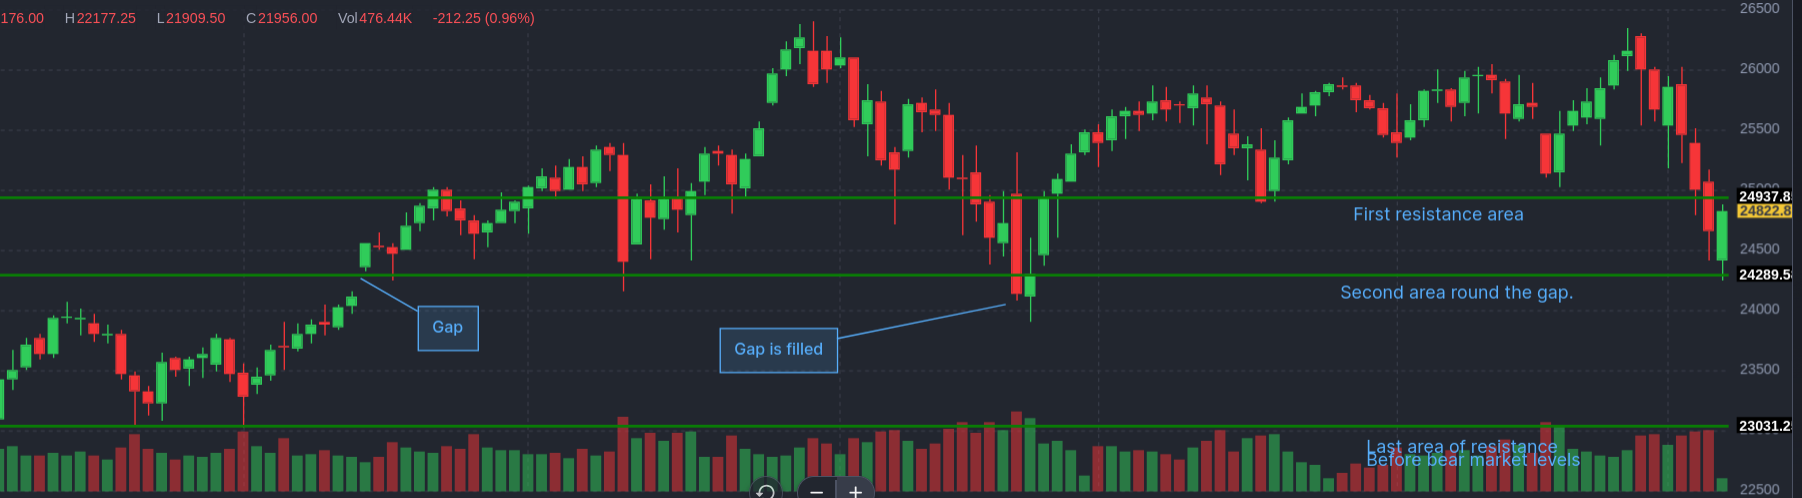
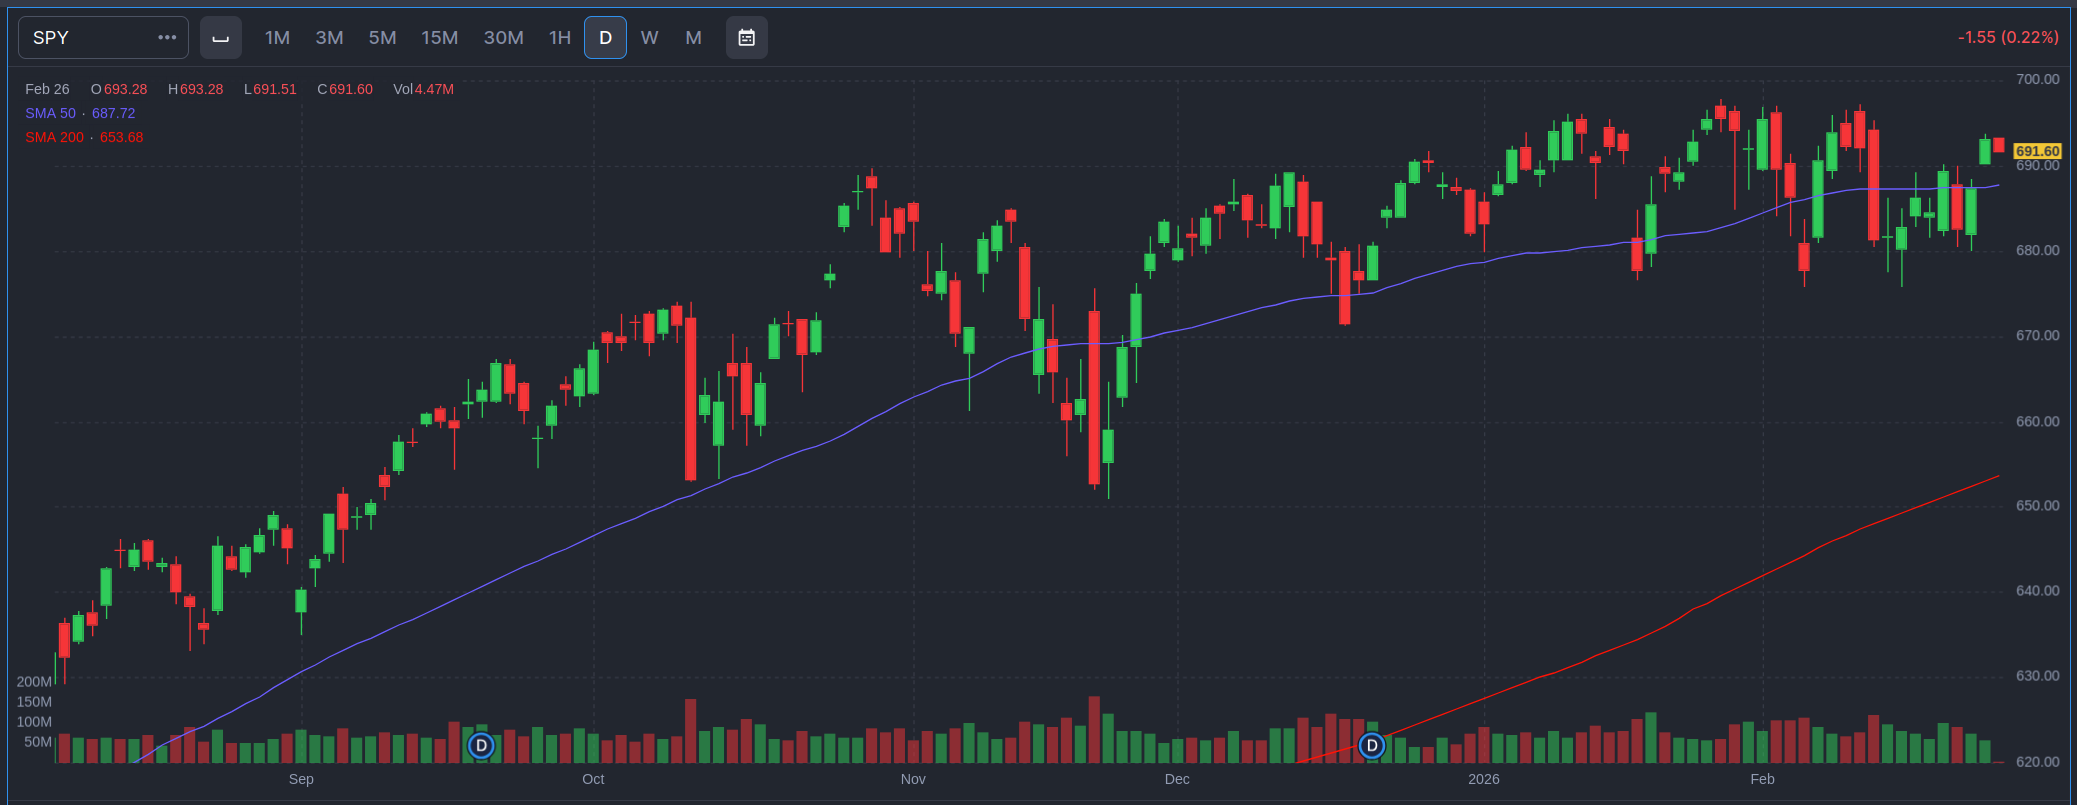
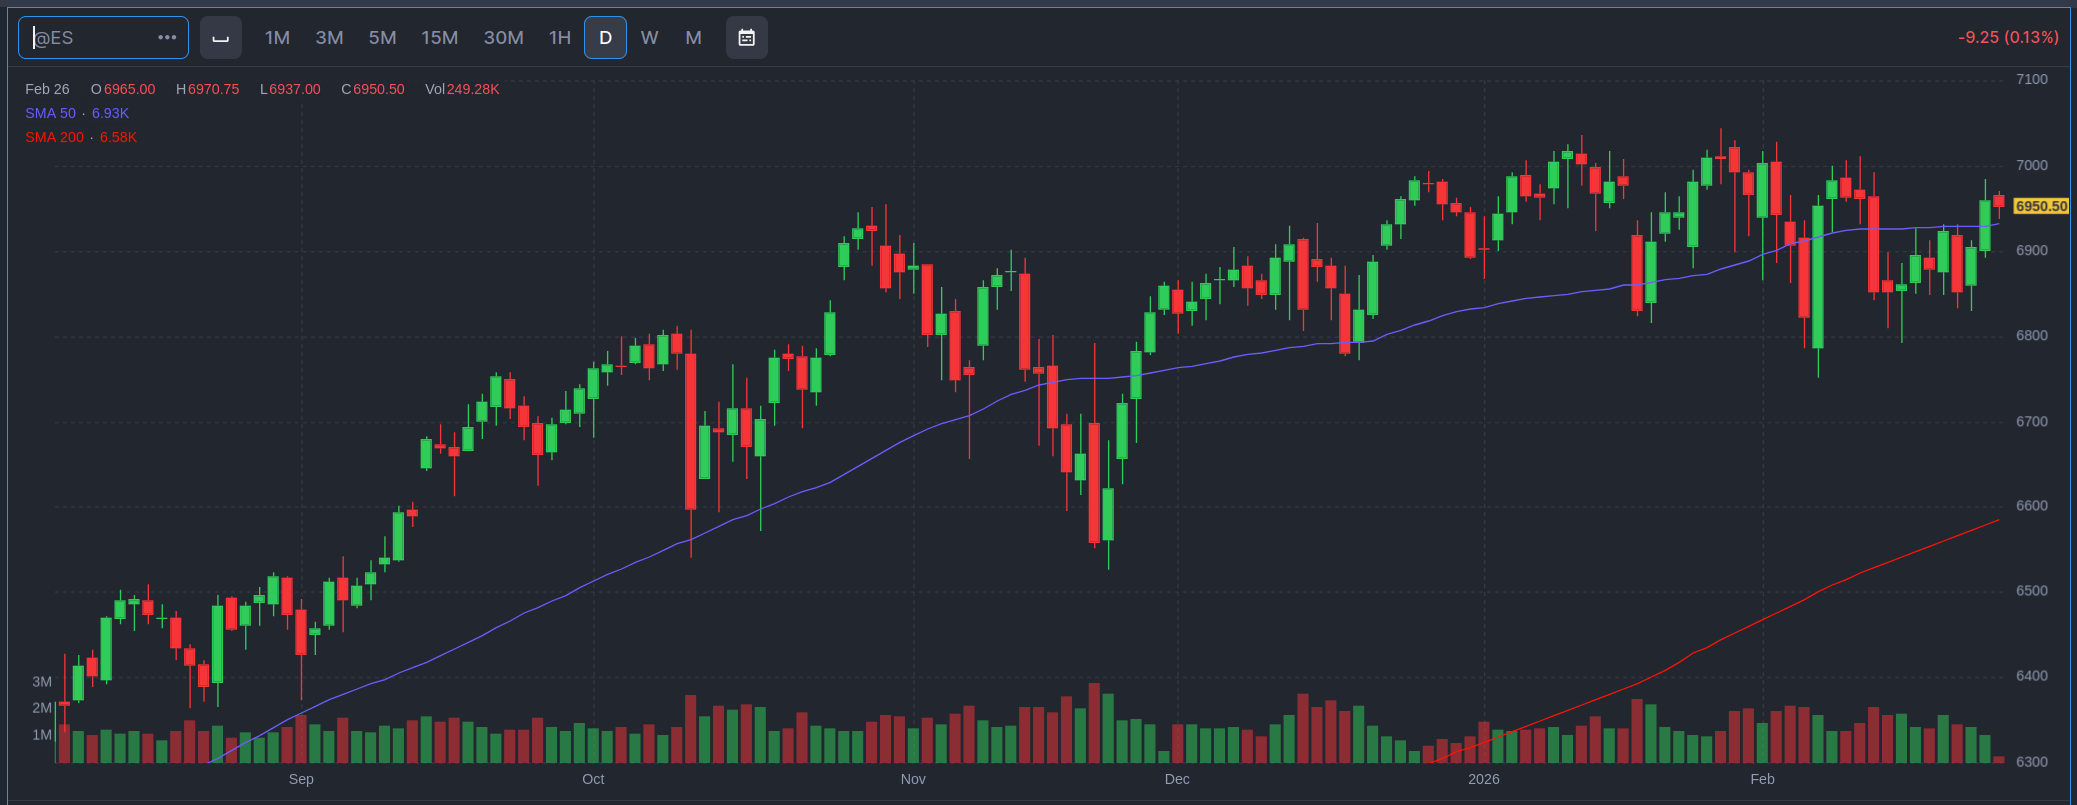
This is the “cash” index ($SPY) for the S&P 500. That’s different from the index that most people look at, which is actually the price of a futures contract on the S&P 500. The price action is a little different, but not radically different. But the S&P 500 that everyone talks about in the news is actually an expectation of the S&P 500 price in the very near future, traded almost continuously. So there are fewer gaps in the price action. The cash index primarily trades during normal trading hours in the US. The chart below is the futures contract and is smoother, with fewer gaps, but it’s basically the same movement.

But what is it really? It’s the behavior of the 500 companies included in the index. The 500 best companies? The 500 most representative companies? The 500 largest companies? Yes and no to all of those questions. These companies fall into sectors: technology, consumer cyclical, consumer defensive, financial, communication services, healthcare, industrials, real estate, utilities, energy and basic materials. From the heat map below you can get a sense of their relative size and how they’ve performed over the last three months. Sorry, if you’re red-green color blind, but for squares that are large enough, you get the percentage change.

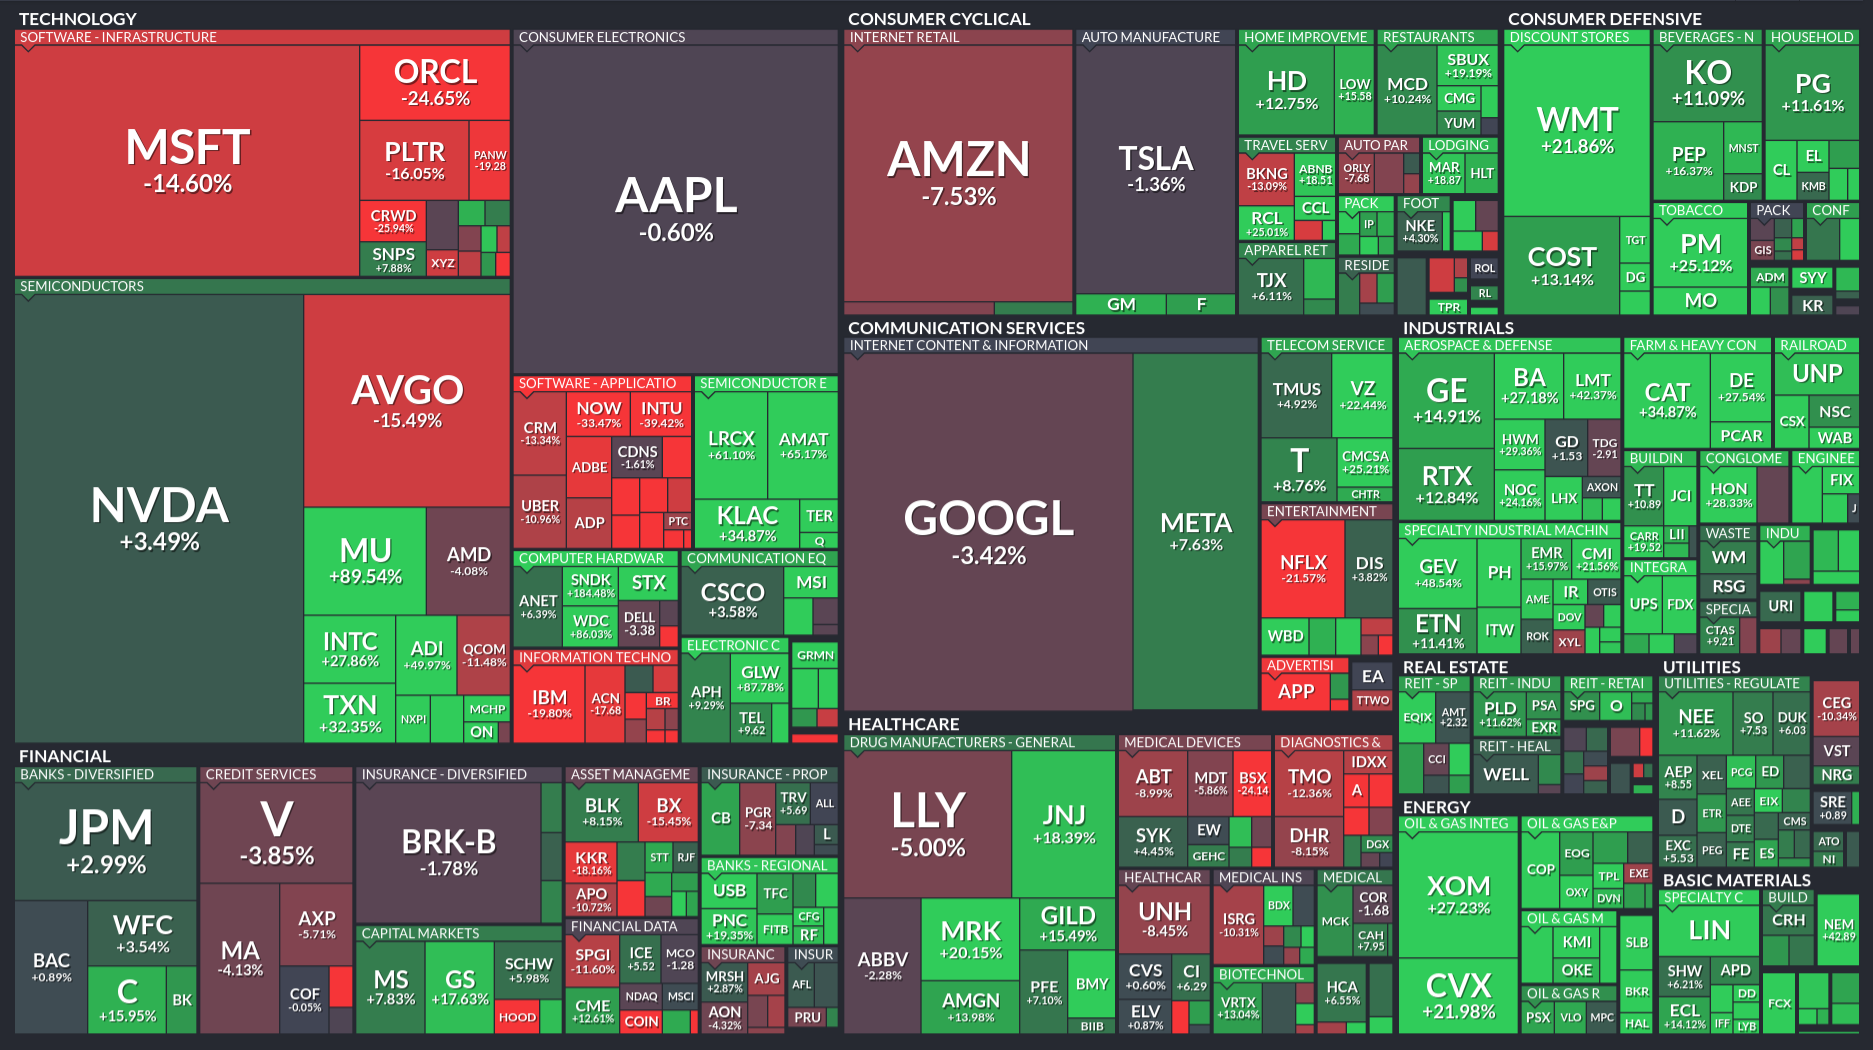
We have different stories about the expected behavior of the sectors under different economic conditions. For example, during a recession, when people are losing their jobs, we expect consumer defensive stocks to hold their value while consumer cyclical stocks to fall. And if we look at the 3 month performance, we can see that defensive stocks have out-performed the aggregate cyclical stocks. These stories aren’t perfect, like maybe TJ Max (TJX) is doing okay because people are bargain hunting more, and maybe McDonald’s (MCD) is doing better because people can’t afford nicer restaurants.

We’ve had a set of contradictory stories. Financials have hit hard, and consumer cyclical and communication services and technology have been meandering to falling. That suggests a slowdown. But material providers, energy, and industrial stocks are rallying. That suggests the early part of a recovery after a recession, when output is picking up. And consumer defensive and utilities are doing great, which is a sign of a slowdown.

What might be going on? I suspect there are two sets of behaviors. Part of the behavior can be ascribed to macro-economic movements and part can be ascribed to idiosyncratic movements. Idiosyncratic is really a short-hand way to say the fish is swimming upstream for a different reason than the current is moving the rest of the fish down stream. I think, in part because the yield curve may be flattening, that the market is anticipating an economic pullback.

That explains the behavior that utilities, financials, consumer cyclicals, consumer defensives, technology, and communication services are exhibiting. I think any strength in technology is coming from the AI bubble. The AI bubble is powering some of the industrials, along with a re-arming of Europe and a possible expansion of the defense spending. The policy chaos and dollar de-risking explain energy prices and basic materials. If the dollar de-values, then the price of commodities and energy will increase for American consumers. If the dollar falls, without doing anything, Exxon Mobile (XOM), Chevron (CVX), etc. will make a lot of money. As will miners.

So here’s the score card. The long term bet being made by most investors appears to be for a weaker economy. That’s not certain. They can be wrong. But that’s what most of the sectors are telling me. (And therefore I could be wrong). My confirmation is that maybe the yield curve is flattening. (But I could be wrong). The dollar is expected to weaken (as per official US policy), and falling interest rates will further weaken the dollar beyond the chaos that is driving countries away from the dollar. That means energy and basic materials have a tail wind. Until such time as we demand less energy because economic activity slows down, and even then we could see prices increasing on net.

Anyway, that’s how I square the circle.


And this is not investing or investment advice to you, or anyone. It’s is provided for your entertainment purposes only. And if you are investing, contact a professional before making any decisions. Buying and selling stocks, futures, or any investment is a risky activity and can cause you to lose money, including the principal which you invest.

A Little Perspective

NVDA is going to announce earnings on Feb. 25. Like everyone else, I think I’m more interested in the forward guidance on sales than sales over the last quarter. I think we’re all looking for an indication of any pull-back in AI capex spending. This would not just be an issue for Nvidia, but also for companies ranging from turbine generator suppliers to utility and real estate companies. Looking at current levels for the NASDAQ, the recent high was about 26,000. A historically normal bear market pull back takes us to just under 21,000. That’s at the bottom end of a congestion area from last December. The S&P 500’s recent high was just above 7,000, meaning it’s 20% retracement is in the 5,600 ballpark.

The difference between a regular bear market pullback, that cleans out some of the deadwood, and something bigger is only visible in the rear view mirror. When the stock market started dipping before the GFC, a lot of people thought this is just about clearing some deadwood from the system. Once it’s done, the infinite money glitch will restart. Jim Cramer gets a lot of shit for the “Buy Bear Stearns” call just before it went tits up. But he wasn’t the only one who genuinely believed Bear Stearns was in a bind but would find its way out. In part because they didn’t have all the information necessary to make that call. They did not know what Bear and its counter-parties knew. They have opinions on dozens of individual stocks and are not specialists who follow just one company. As Bear kept dipping, they thought it was time to buy. The bias sell side analysts have toward buying just made them look that much dopier when it happened.

Contrast what happened with the sharp pullback and return during the start of the COVID lockdown. The S&P 500 went from almost 3,400 to 2,200, well over 20% and came back fairly quickly. In six months it was pushing new highs as we sat around swimming pools, masks on, glaring at the neighbor jogging by without their mask. Okay, that was one stock versus a whole market, but after the 1929 crash, the stock market came back in what’s called a bull trap. Price came back, people bought in, and then resumed their slide. In fact, the prices came back to nearly the 1929 top.

I don’t know, Jim Cramer doesn’t know, and no one knows if Nvidia’s earnings announcement will cause investors to double down, pull back, or continue to waffle in the trading range. Or pull back for a couple of months, come down 20%, and then come back. As Yogi Berra said, predictions are hard, especially about the future.

But it’s good to clear out the deadwood. For example, the zero days till expiration options trading may be contributing nothing more than volume, income for brokers, and some volatility. I would say it would be nice to wash those folks out of the market, but I suspect a majority are not professional traders. They think they are, but they’re just gambling on whatever free broker they’re using. It would also be nice to nip the prediction markets betting on the market in the bud. But again, that’s not done by people whose wealth moves by six or seven figures on a daily basis. It’s done by people who can’t replace their fridge, if it breaks.

But then again, other than time horizon and belief, what makes someone betting Tesla will move up at least half a percent today, different from me? I have a longer timeline. And for the last 100 years, we’ve seen the US economy grow and wealth accumulate in assets like stocks. Over a long enough time-line (with an important asterisk there about when you buy in and when you cash out), people have generally done well. But we wouldn’t be the first example of a country killing its golden goose for the dumbest of reasons. London has played second fiddle to New York for some time, but Brexit has accelerated its trajectory into irrelevance. Now, its best financial innovation is possibly loosening laws to become more like Dubai, where it’s anything goes (including fraud). Once, even after the US economy eclipsed the British Empire, London was the financial and insurance center of the world.

At some point, the hyper-scalers will need to stop buying Nvidia hardware unless they figure out profits from AI. The market is already giving Google, Amazon, and Microsoft the side eye for heavy capital spending to support AI. The punishment by the street for not investing in AI might be worse right now. But at some point, if AI isn’t making real money (and not just redeeming credits issued in exchange for ownership in Open AI or Anthropic), money spent on AI chips or data centers would be better used to buy back stock. At that point Pinchai, Nadella, and Jassy might decide to stop advertising their AI capex spend, as it would be driving down the stock, and focus on “core competency.” They will pivot by laying off a bunch of people and fucking over a bunch of contractors who anticipated the completion of additional data centers. Oh well. Somewhere between now and that possibly distant future, I expect to break Nvidia to break down from its trading range. Unless it doesn’t.


This is not investing or investment advice to you, or anyone. It’s is provided for your entertainment purposes only. And if you are investing, contact a professional before making any decisions. Buying and selling stocks, futures, or any investment is a risky activity and can cause you to lose money, including the principal which you invest.

Another Look at Nvidia

This is not investment or investing advice. It is for entertainment purposes only. Contact your investment or tax professional before making any investment decisions.

A couple of days ago I took a look at Nvidia, to kind of show how I look at where the stock is headed. I actually prefer to buy ETFs or funds than stocks, but I do buy some individual stocks. And some of what I say is also applicable to those funds and ETFs. Although you have to look at them individual and figure out if the ETF or fund matches your objectives. I learned this early on when I bought into some funds to see the sector outperform the fund, only to realize the weighting the fund used wasn’t what I expected.

I use the term support line, but I think of it as more of an area. It’s not that buyers come into the market at 170.95 and lift the price. It’s more that when the stock gets to that price, various people are stepping in to buy. And I use the term people here very loosely. It is a combination of ETFs and funds, along with large institutional investors. It used to be that lunch time on say, Wednesday, you could actually put in a trade that would move a sock price. But I don’t think that’s true any more, mostly because trading volumes are much larger.

Anyway, once prices hit a certain zone, buyers seem to step in and keep the price from falling. It may only be a pause on its way to lower levels. Most support lines are found buy simply eye-balling where a series of lows caused the price action to reverse. It may have dropped below that level for a bit, but quickly comes back up. When the price action drops to the support and comes back up that’s called “testing” a support and the more that happens, the more significant the support area becomes. I picked 171 because I see the price approaching that area multiple times and bouncing back. I don’t think exact numbers are particularly useful.

But the whole market is taking a breather in the morning pre-market session. Nvidia (NVDA) is part of the NASDAQ composite index. (Don’t ask me what NASDAQ stands for). It is a significant part of the index, so it’s behavior will impact the broader index behavior. To me there’s a support area extending from about 600 to 585. (This is the QQQ, which is the cash index for the NASDAQ 100). I view the support areas to be less precise on the cash index because it is the byproduct of a lot of buying and selling, both through the index and its individual components. The line on top is not a support line, it’s a resistance line that suggests most market participants decide anything above 630 drives selling.

The chart of the cash index is different from what most people look at when they look at the NASDAQ, they look at the futures market, as shown below. It is not the product of buying and selling stocks. It is the the prices of the futures market for the index. A different thing is being traded. In the futures market, we see a gap that doesn’t exist on the cash index, and the prices look almost, but not quite, the same.

On the chart of the NASDAQ futures, I see a similar support area but I think they’re actually two support lines. There’s one at 24,937 (remember – not exact) and one at 24,289 (not exact). Remember, I eye-balled the lines and read the price from there. I didn’t pick the price and draw the line. We ploughed right through the first line (which probably means it wasn’t really an area of support). And today, the pre-market is bouncing off the second line, meaning it’s holding. That second line is formed on the basis of it being the bottom of the gap (which was eventually filled). But again, it’s more that zone around 24,289 where a mix of funds, algorithms, and large institutions will see a buying opportunity.

Looking at the S&P 500 Futures I’ve identified what I think is a trend channel. We see a failure to make a higher high at the end of the channel, and a break down from the channel (which we won’t know is significant until we’ve had more than a couple of days trading lower). And we briefly pushed into what I think is a support area. The support area holding means going lower will be a challenge, but the other factors are bearish. (Meaning there’s more interest in selling). But this is just to show the broader market is pausing at some level of support.

To be honest, I have no earthly idea what makes a large fund decide the prices to buy or sell NVDA or the other components of the NASDAQ, a NASDAQ future, or any stock. Maybe they just think we’ve come too far these last couple of days and they’re buying the dip. Maybe it’s just selling or buying to offset options contracts. I really don’t know. And no one knows, except for one thing that investors made clear with Google yesterday and AWS today. They are no longer looking at hundreds of billions of AI investment as paving roads for future growth. They’re looking at it as burning money that may not come back. And because many investors (both small and institutional) use baskets of stocks (like ETFs), stocks are now more likely to move similarly than before.

To wrap this up, I wrote this to clarify my thinking on what’s going on with the market. To remind myself, that even though I drew a line, It should have been a fuzzy, broad line, not a precise, skinny one at a specific number. I also like to see what the giant ball of money is doing today. It’s sloshing away from defensive investments, like consumer staples, and back to risk and tech, now that we had a big move away. That money sloshes back and forth, back and forth, each time allowing the smart money to bleed more and more off retail investors.

And this is not investing or investment advice to you, or anyone. It’s is provided for your entertainment purposes only. And if you are investing, contact a professional before making any decisions. Buying and selling stocks, futures, or any investment is a risky activity and can cause you to lose money, including the principal which you invest.

[Update] The screen shots above are from the pre-market session. The regular session can look a little different, for example, here’s NVDA, note the slightly different representation of today’s candlestick. Which is also a reminder that what you see may be determined by the conditions under which the prices were collected.